
Power of a Power Rule by rmchugh1
Loading the math board and drawing, please wait…
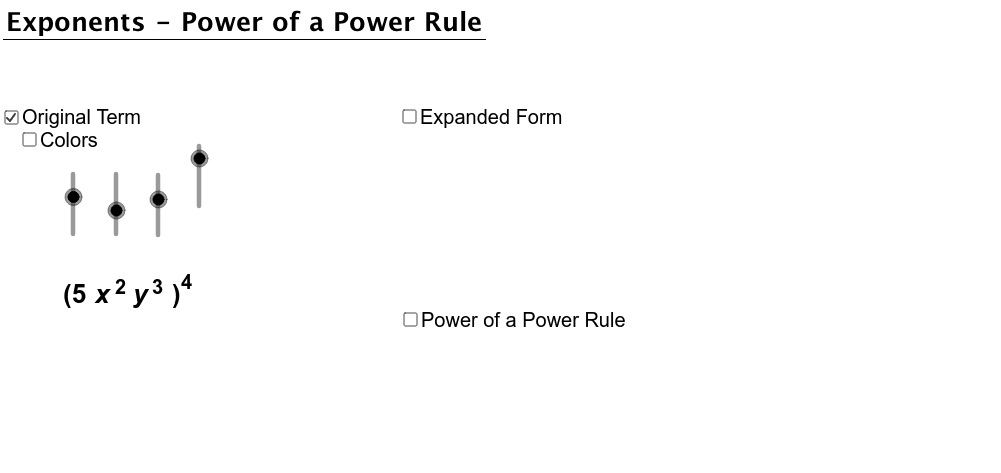
This example demonstrates the power of a power rule, (a^m)^n = a^(m*n). Using GeoGebra commands like Sequence and Translate, it dynamically shows the effect of different powers. Suitable for middle school and above students to learn about exponent operations.
GeoGebra Commands & Parameters
Text("y") → text6Text("x") → text5Text(expX1 + "") → text8Text(expY1 + "") → text10If(color, 255.0, 0.0) → factorColor255If(color, 153.0, 0.0) → factorColor153Translate((6.923609046978582, -1.782455570499752), Vector[Vector[(0.0, 0.0), (0.0, -3.0)]]) → ATranslate((6.923609046978582, 0.217544429500248), Vector[Vector[(0.0, 0.0), (0.0, -3.0)]]) → BTranslate((7.524258469913336, 0.217544429500248), Vector[Vector[(0.0, 0.0), (0.0, -3.0)]]) → CTranslate((7.524258469913336, -1.782455570499752), Vector[Vector[(0.0, 0.0), (0.0, -3.0)]]) → DSequence(Translate[If[expY1 ≟ 1.0, y1, If[expY1 ≟ 2.0, y2, If[expY1 ≟ 3.0, y3, If[expY1 ≟ 4.0, y4, y5]]]], Vector[(0.0, 0.0), (0.7 * i, 0.0)]], i, 0.0, exp - 1.0) → ExpandYSequence(Translate[If[expX1 ≟ 1.0, x1, If[expX1 ≟ 2.0, x2, If[expX1 ≟ 3.0, x3, If[expX1 ≟ 4.0, x4, x5]]]], Vector[(0.0, 0.0), (0.7 * i, 0.0)]], i, 0.0, exp - 1.0) → ExpandX
AI Drawing Prompt Reference
Draw a coordinate system with x and y axes spaced at intervals of 1. Plot the graphs of functions y=x^1, y=x^2, y=x^3, y=x^4, and y=x^5, then shift each graph 0.7 units to the right sequentially, for a total of 4 shifts. Next, plot the graphs of functions x=y^1, x=y^2, x=y^3, x=y^4, and x=y^5, and shift each graph 0.7 units to the right sequentially, for a total of 4 shifts.
The prompt above was compiled from the original drawing commands and is for reference only.