
Power Function Graph
Loading the math board and drawing, please wait…
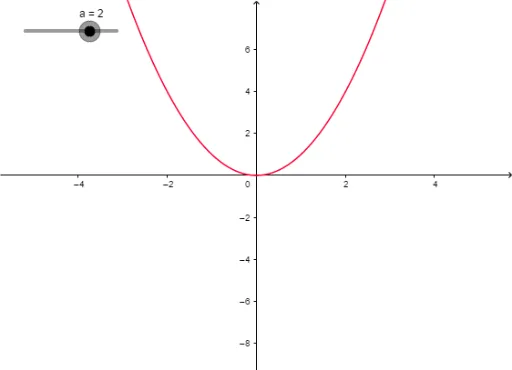
This example demonstrates the graph of a power function, which is of the form y=x^n where n is a real number. By adjusting the parameter n, the impact of different powers on the function's graph can be observed. The construction involves objects a, text1, f, and text3, focusing on graphing. Suitable for high school mathematics education and learning.
GeoGebra Commands & Parameters
Numeric a(2)f(x) = x^(a)
AI Drawing Prompt Reference
Draw the graph of a power function y=x^n, where n is a real number. Adjust n to observe how different powers affect the graph. Start by setting n to 2 and then plot the graph of y=x^2.
The prompt above was compiled from the original drawing commands and is for reference only.