
Porta: Connections Map via Constructed Line Segments
Loading the math board and drawing, please wait…
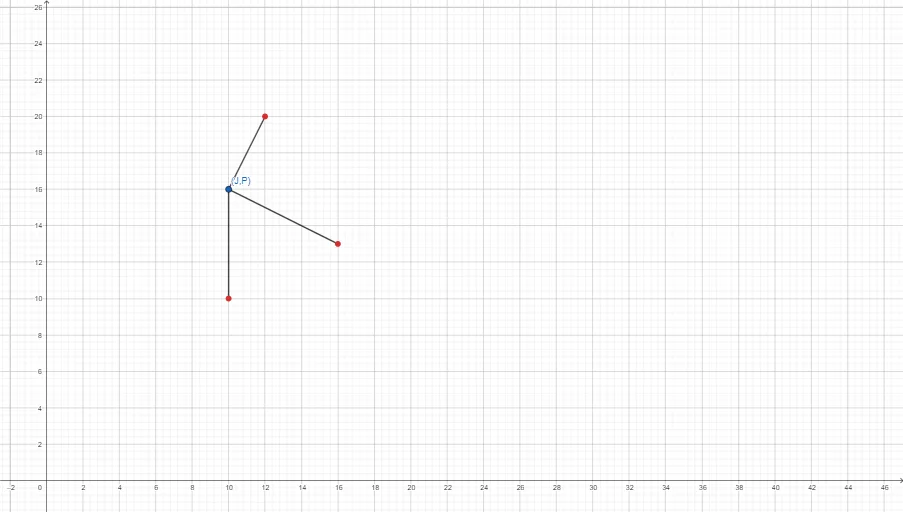
This example demonstrates a “connections map” style construction, where multiple geometric points are linked through line segments whose endpoints are tied to function-related quantities. The resulting diagram highlights how geometric structure emerges from imposed relationships between segments and functions. Key concepts include coordinate geometry, line segments and ratio/proportional relationships, function modeling with power-function and hyperbola-related ideas, and an intuition drawn from integral calculus about how certain accumulated quantities relate to geometry. Construction-wise, it is driven by the GeoGebra command Segment, creating the segment objects A, B, f, C, g, D, and h; these labeled objects act as connection nodes, revealing the mapping between selected points and the underlying function-associated constraints. Suitable for advanced secondary school and early university coursework, especially for teaching geometric construction together with function and calculus connections.
GeoGebra Commands & Parameters
Segment(A, B) → fSegment(A, C) → gSegment(A, D) → h
AI Drawing Prompt Reference
Draw a geometric structure diagram where point A is connected to points B, C, and D with three line segments f, g, and h. These segments illustrate the geometric mapping between points and function relationships, showing how geometric structure emerges from the relationships between segments and functions. Start by placing points A, B, C, and D, then draw line segments f, g, and h connecting A to B, A to C, and A to D, respectively.
The prompt above was compiled from the original drawing commands and is for reference only.