
Polynomial Root Visualizer
Loading the math board and drawing, please wait…
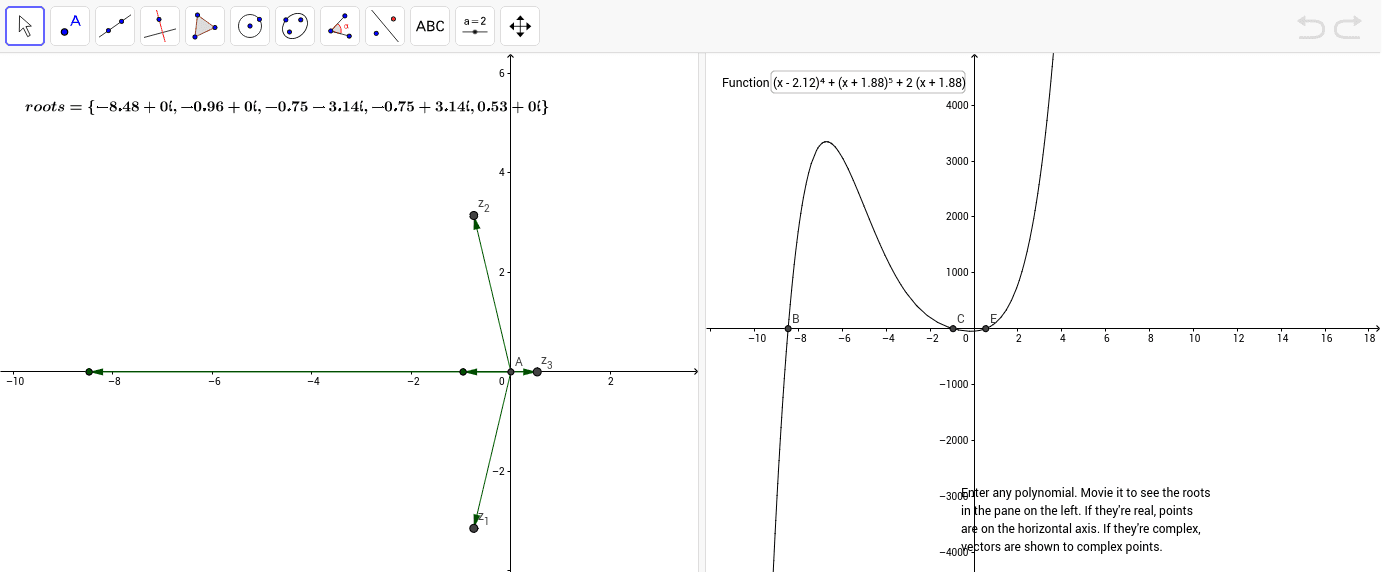
This GeoGebra example dynamically visualizes the graph of a polynomial function and its roots, supporting real, complex, or mixed root types. It demonstrates the relationship between polynomial equations and their roots in the complex plane, covering core concepts such as the Fundamental Theorem of Algebra, complex numbers, and function graphing. Construction utilizes GeoGebra commands including ComplexRoot, Intersect, Vector, Sequence, and objects like input fields, points, and lists. It is suitable for high school and higher education mathematics, particularly for teaching polynomial root behavior and complex function visualization.
GeoGebra Commands & Parameters
ComplexRoot(f) → w, w_2, , , ,Intersect(xAxis, yAxis) → AVector(A, w) → uVector(A, w_2) → vTextfield(f) → inputBox1Intersect(f, y = 0) → B, C, E, FPoint(list1) → DVector(A, D) → bSequence(Vector[(0, 0), Element[list1, t]], t, 1, Length[list1]) → list2Sequence(Element[list1, t], t, 1, Length[list1]) → list3
AI Drawing Prompt Reference
Create a dynamic visualization of a polynomial function graph, with roots that can be real, complex, or mixed. Show the function curve intersecting the x-axis at real roots, and use vectors from the origin to represent complex roots in the complex plane. Include an input field to edit the polynomial expression, and generate a sequence of vectors from the origin to each root, along with a list of root points. The overall layout includes coordinate axes, the function curve, root points, vectors, and an input control, illustrating the Fundamental Theorem of Algebra and polynomial root behavior.
The prompt above was compiled from the original drawing commands and is for reference only.