
Polynomial Extrapolation and Interpolation Visualization
Loading the math board and drawing, please wait…
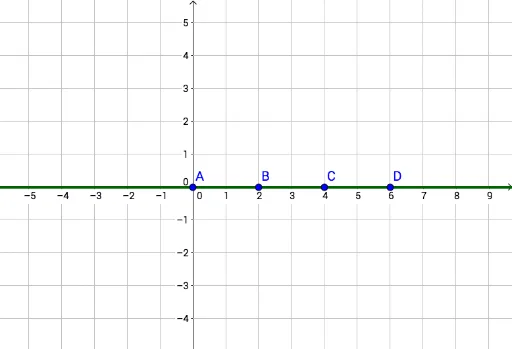
This example demonstrates how polynomial interpolation and extrapolation graphs change when moving points around. It involves core math concepts like polynomial functions, interpolation, extrapolation, and data fitting. Constructed using GeoGebra's FitPoly command to fit a polynomial function f through points A, B, C, D. Suitable for high school mathematics teaching to understand data fitting and polynomial applications.
GeoGebra Commands & Parameters
FitPoly({A, B, C, D}, 3) → f
AI Drawing Prompt Reference
Draw a fourth-degree polynomial function passing through points A, B, C, and D. First, create four points A, B, C, and D, then fit a fourth-degree polynomial function f through these points. Observe how the function graph changes when you move these points, to understand the concepts of interpolation and extrapolation.
The prompt above was compiled from the original drawing commands and is for reference only.