
Polar Function Graphing
Loading the math board and drawing, please wait…
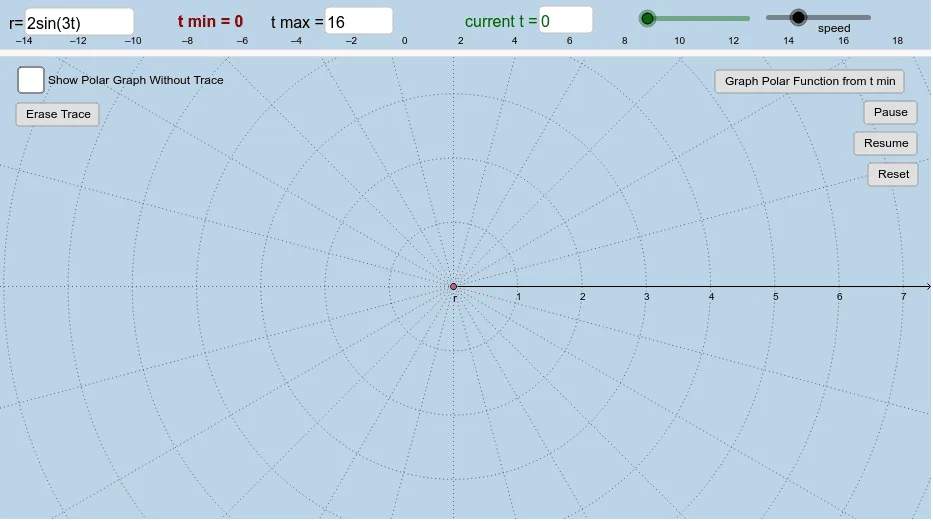
① This example demonstrates an interactive polar equation grapher in GeoGebra, allowing users to input custom theta min/max values and observe the curve being traced dynamically. ② Core mathematical concepts include polar coordinates, polar equations r=f(θ), the relationship between angle and radius, and how parameter ranges affect the shape of the graph. ③ Construction highlights: uses Textfield and InputBox for user input, CurveCartesian to convert polar to Cartesian coordinates for plotting, Rotate and Angle to visualize angular components, buttons (button1-5) to control trace display/clearing and animation, a slider (speed) to adjust drawing speed, and objects like t, A, r, B, C, D, E, F to build dynamic geometric relationships. ④ Suitable for high school or early college students learning polar coordinates and function graphing, as well as for teachers demonstrating how changing parameters in polar equations alters the resulting curve.
GeoGebra Commands & Parameters
Textfield(r) → InputBox1Textfield(t) → InputBox2Segment(C, B) → aCurveCartesian((r(t) * cos(t)), (r(t) * sin(t)), t, 0, 6.283185307179586) → bTextfield(tmax) → InputBox3Rotate(F, t, E) → F'Angle(F, E, F') → α
AI Drawing Prompt Reference
Create an interactive polar graph where users can input a polar equation and set the angle range. Show a rotating angle from its initial side to the current position, with a radius segment connecting the pole to the curve point. The polar curve is traced as the angle increases from minimum to maximum, using a dynamic trace. Include input fields for the equation and angle limits, buttons to play, pause, and clear the trace, and a speed slider to control drawing pace. The visualization highlights how radius changes with angle.
The prompt above was compiled from the original drawing commands and is for reference only.