
Plotting Polar Coordinates: Interactive Introduction
Loading the math board and drawing, please wait…
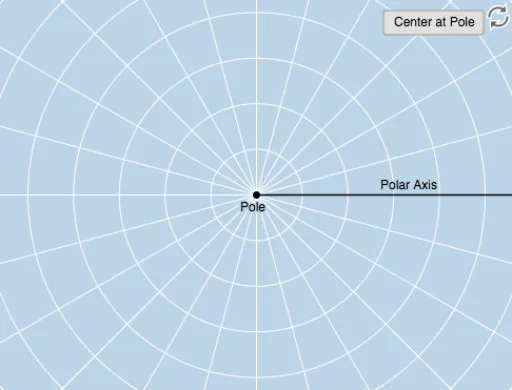
① This interactive example demonstrates how to plot points using polar coordinates, allowing learners to visually grasp the correspondence between (r, θ) and positions on a plane. ② Core mathematical concepts include the definition of polar coordinates, measurement of angle and radius, coordinate conversion, and the relationship between polar and Cartesian systems. ③ Construction highlights: using GeoGebra commands such as Ray (for the polar axis), Circle (for radius), Rotate and Angle (to construct angles), Textfield and InputBox (for interactive input), Intersect and Dilate (for locating points), Vector and Line (to show geometric relations), and Mirror (for symmetry operations), creating a dynamic adjustable environment for polar plotting. ④ Suitable for middle-to-high school mathematics (analytic geometry or trigonometry) and introductory college-level coordinate systems, ideal for classroom demonstrations or self-guided exploration.
GeoGebra Commands & Parameters
Ray(B, C) → fCircle(B, D) → cTextfield(r) → InputBox1Textfield(b) → InputBox2Rotate(D, b, B) → D'Rotate(D, If[0 < d ≤ 1, (d * b), b], B) → D'_1CircleArc(B, D'_1, D) → eCircle(B, D) → gRay(B, D') → hCircleArc(B, D, D'_1) → kAngle(D, B, D') → αAngle(D', B, D) → βCircle(B, abs(r)) → pIntersect(p, h) → A,Dilate(B, If[1 < d ≤ 2, 2 - d, 0], A) → B'Vector(B, B') → uLine(B, A) → iMirror(B, B) → B'_1Mirror(D', B) → D''Ray(B'_1, D'') → h'Mirror(u, B) → u'Intersect(p, i) → E, F
AI Drawing Prompt Reference
Create an interactive plot showing how to locate points using polar coordinates (r, θ). Include a polar axis ray and a circle for the radius, with sliders for angle and radius input. Rotate an arc to demonstrate angle changes and show the conversion between polar and Cartesian systems. Use vectors, lines, and mirror operations to display geometric relationships, forming a dynamic adjustable plotting environment.
The prompt above was compiled from the original drawing commands and is for reference only.