
Polar Function Grapher by Tim Brzezinski
Loading the math board and drawing, please wait…
In collections
Polar Coordinates (Non-Calculus)
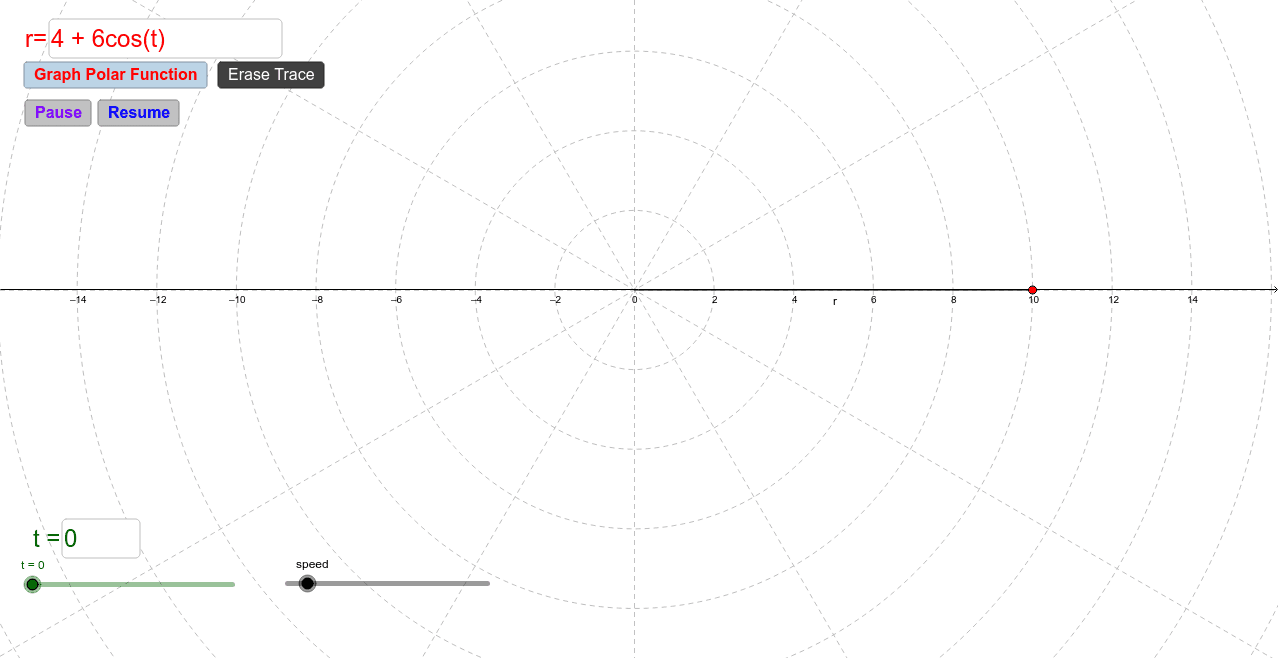
This example demonstrates how to use GeoGebra to graph polar functions. Key mathematical concepts include polar coordinates and function graphs. The construction involves commands like TextField, Segment, and InputBox. Suitable for high school and above students or teachers.
GeoGebra Commands & Parameters
Textfield(r) → InputBox1Textfield(t) → InputBox2Segment(C, B) → a
AI Drawing Prompt Reference
Draw a polar function graph by inputting the expression for r and angle t, then plot the polar curve based on these inputs. First, input the expressions for r and t, and then plot the polar curve.
The prompt above was compiled from the original drawing commands and is for reference only.