
Polar curves: wrapping functions around the pole
Loading the math board and drawing, please wait…
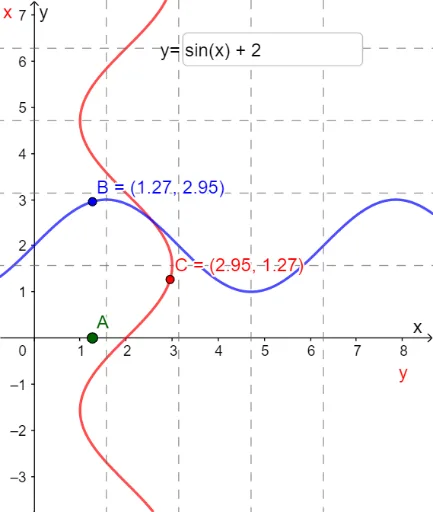
This example demonstrates how to draw polar curves by wrapping functions around the pole using polar coordinate equations. Key math concepts include polar coordinate systems, function graphs, and rotational symmetry. It utilizes GeoGebra commands/objects like Point, CurveCartesian, and Textfield, with InputBox1 for parameter input, to plot and label key points and equations. Suitable for high school students learning about the properties of polar function graphs and the effects of parameter changes.
GeoGebra Commands & Parameters
Point(xAxis) → ACurveCartesian((f(θ); θ), θ, 0, x(A)) → bCurveCartesian((f(θ); θ), θ, x(A), 0) → cTextfield(f) → InputBox1