
Polar Coordinates Example 3
Loading the math board and drawing, please wait…
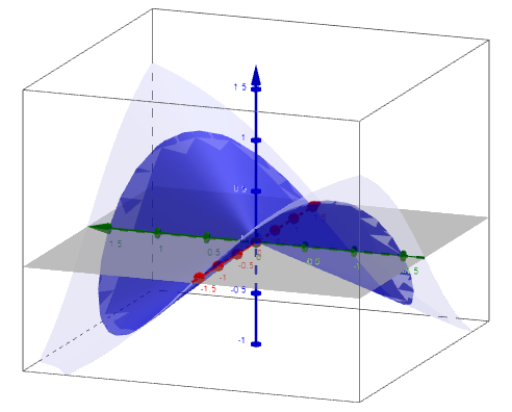
This example demonstrates how to plot functions using polar coordinates and visualize their variations. Key math concepts include polar coordinate systems, function graphs, and parametric equations. It utilizes GeoGebra commands/objects: f (function), r (radius), a (angle), and b (range) as per the construction summary. Suitable for high school and above students to understand polar coordinate applications and function graphing.
GeoGebra Commands & Parameters
f(x, y) = ((x * y)) / sqrt(x^(2) + y^(2))Numeric r(1.5)a(x, y) = x^(2) + y^(2) ≤ r^(2)b(x, y) = If[x^(2) + y^(2) ≤ r^(2), f(x, y)]