
Polar Coordinates by Malin Christersson
Loading the math board and drawing, please wait…
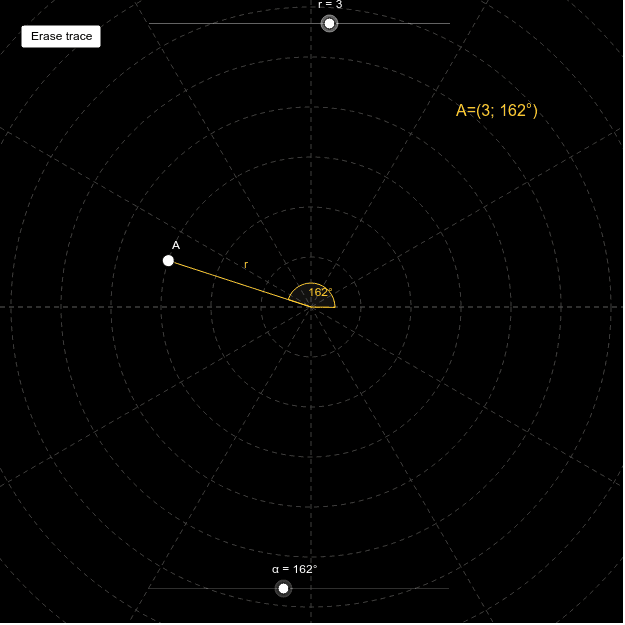
This example demonstrates the effect of changing the radius r on the position of points in polar coordinates; core math concepts include the definition of polar coordinates, point representation, and the influence of parameter r on the shape; construction highlights involve using Angle and Segment commands, with objects like α, r, A_1, button1, β, s, A_2, text1 for interactive demonstration; suitable for high school students and teachers learning polar coordinates and analytical geometry.
GeoGebra Commands & Parameters
Angle((1, 0), (0, 0), A_1) → βSegment((0, 0), A_1) → s
AI Drawing Prompt Reference
Draw a polar coordinate diagram with the origin at the center. From the origin, draw a horizontal ray as the polar axis. Place a point above the axis, connect it to the origin with a segment, and label the angle between the segment and the axis. Include a slider to adjust the distance from the origin to the point, dynamically changing the point's position and the angle. The diagram should clearly illustrate the relationship between radius and angle in polar coordinates, suitable for teaching.
The prompt above was compiled from the original drawing commands and is for reference only.