
Polar and Rectangular Coordinates by Arthur Lee
Loading the math board and drawing, please wait…
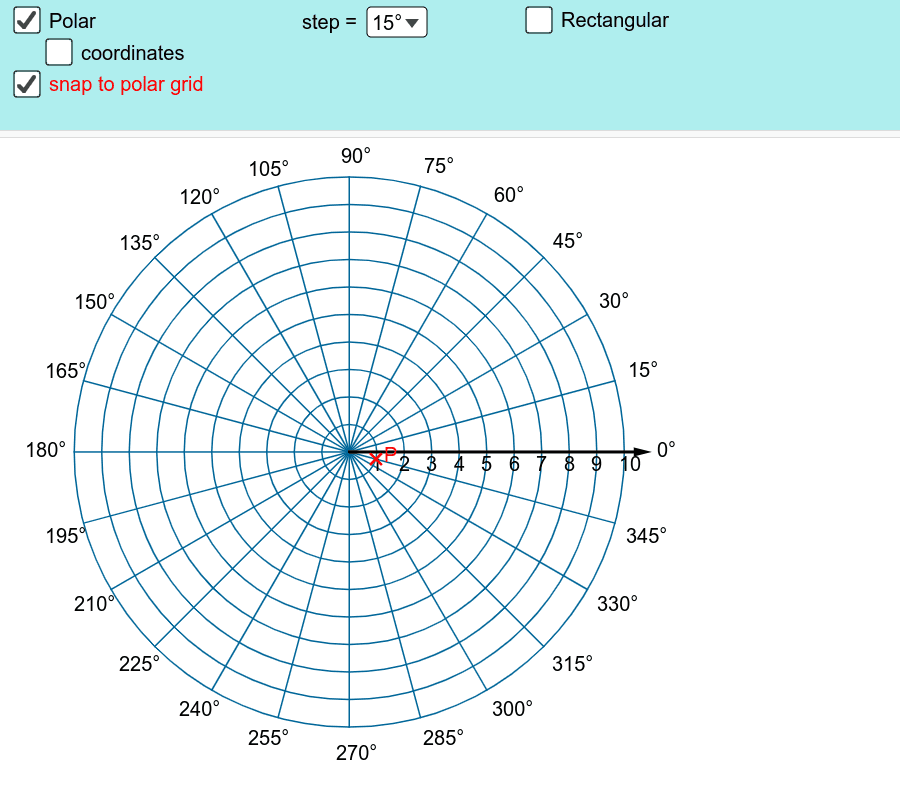
This example demonstrates the conversion between polar and rectangular coordinates on different grids. It involves core math concepts like coordinate transformation, vectors, sequences, and geometric constructions. GeoGebra commands like Sequence, Point, Text, Vector, and conditional statements (If) are used to plot points, display vectors, and show coordinates. Suitable for high school and above, focusing on coordinate systems and geometric representations.
GeoGebra Commands & Parameters
Sequence(Sequence[((r * cos(theta)), (r * sin(theta))), theta, 0*°, 359*°, SelectedElement[listAngle]], r, 0, R) → listPointPoint(listPoint) → P_{pol}Sequence(Circle[(0, 0), r], r, 1, R) → listCircleText("90°", ((-0.3), R + 0.5)) → text2Vector((R + 1, 0)) → uText("180°", ((-R) - 1.8, (-0.2))) → text3Text("0°", (R + 1.2, (-0.2))) → text1Text("270°", ((-0.5), (-R) - 1.2)) → text4Sequence(Text[r, (r - 0.2, (-0.7))], r, 1, R) → listTextAxisSelectedElement(listAngle) → angleSequence(Segment[(0, 0), ((R * cos(theta)), (R * sin(theta)))], theta, 0*°, 360*°, angle) → listRadiusThinSelectedIndex(listAngle) → angleIndexSequence(Text[((theta / π * 180))°, (((R + 0.5) * cos(theta)), ((R + 0.5) * sin(theta)))], theta, If[angleIndex ≥ 3, angle, 10*°], 89*°, If[angleIndex ≥ 3, angle, 10*°]) → listTextQ1Sequence(Text[((theta / π * 180))°, (((R + 0.4) * cos(theta)) - 1, ((R + 0.4) * sin(theta)))], theta, 90° + If[angleIndex ≥ 3, angle, 10*°], 179*°, If[angleIndex ≥ 3, angle, 10*°]) → listTextQ2Sequence(Text[((theta / π * 180))°, (((R + 0.4) * cos(theta)) - 1, ((R + 0.4) * sin(theta)) - 0.6)], theta, 180° + If[angleIndex ≥ 3, angle, 10*°], 269*°, If[angleIndex ≥ 3, angle, 10*°]) → listTextQ3Sequence(Text[((theta / π * 180))°, (((R + 0.4) * cos(theta)), ((R + 0.4) * sin(theta)) - 0.6)], theta, 270° + If[angleIndex ≥ 3, angle, 10*°], 359*°, If[angleIndex ≥ 3, angle, 10*°]) → listTextQ4Sequence(Segment[(0, 0), ((R * cos(theta)), (R * sin(theta)))], theta, 0*°, 360*°, If[angleIndex ≥ 3, angle, 10*°]) → listRadiusThickIf(fixPolar, "P(" + (Length[P_{pol}]) + ", " + (arg(P_{pol})) + ")", "P(" + (Length[P_{rec}]) + ", " + (arg(P_{rec})) + ")") → textPolarIf(fixPolar, "P(" + (x(P_{pol})) + ", " + (y(P_{pol})) + ")", "P(" + (x(P_{rec})) + ", " + (y(P_{rec})) + ")") → textRect
AI Drawing Prompt Reference
Draw a graph showing the conversion between polar and rectangular coordinates. The graph includes a circle centered at the origin with radius R. Four directions are marked on the circle: 90 degrees, 180 degrees, 0 degrees, and 270 degrees, with text labels. There are radius line segments from the origin, and text labels for each quadrant. The construction order is to draw the circle first, then add direction markers, then draw radius segments, and finally add quadrant text.
The prompt above was compiled from the original drawing commands and is for reference only.