
Poisson Distribution Calculator
Loading the math board and drawing, please wait…
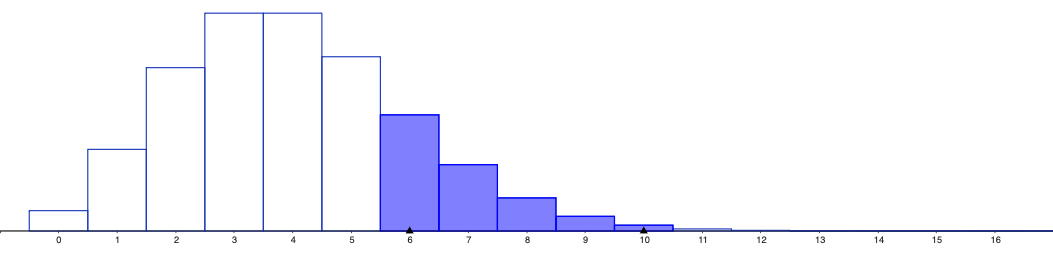
① This interactive calculator demonstrates the Poisson distribution's probability mass function and how its shape changes with the parameter λ. ② Core mathematical concepts include the Poisson distribution, which models the number of rare events in a fixed interval, with probability P(X=k)=e^(-λ)λ^k/k!, and the role of the mean rate λ. ③ Construction: although no specific GeoGebra commands are listed, a typical implementation uses a slider to adjust λ, a function to define the PMF, and plots bars or points to visualize the distribution, possibly with cumulative probability calculations. ④ Suitable for high school to undergraduate statistics courses, helping students intuitively grasp the properties of the Poisson distribution, parameter effects, and real-world applications such as queuing theory and quality control.
AI Drawing Prompt Reference
Create a graph of the Poisson distribution's probability mass function, using a slider to adjust the parameter λ and showing the shape changes for different λ values. Plot a histogram or points to visualize the distribution and calculate cumulative probabilities.
The prompt above was compiled from the original drawing commands and is for reference only.