
Point-by-Point Quadratic Function Plotting
Loading the math board and drawing, please wait…
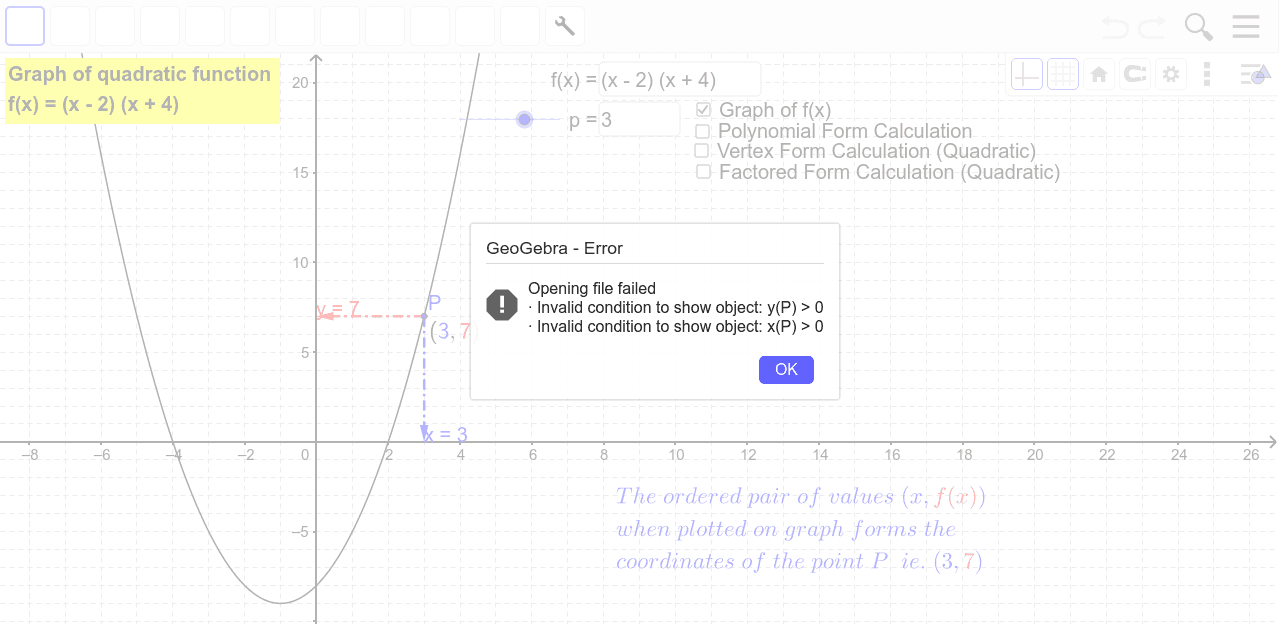
This example demonstrates the process of plotting quadratic functions by calculating points individually. It involves core math concepts like the general form ax^2+bx+c, function graphing, and the impact of coefficients on the graph. Key GeoGebra commands and objects used in the construction include Coefficients, Sequence, and CoordinatePointeronAxisToolNew. It is suitable for high school students to understand the graphing process and coefficient effects on function images.
GeoGebra Commands & Parameters
Coefficients(f) → list1Length(list1) → n_tElement(list1, 2) → bElement(list1, 1) → aSequence(h_{p}(x)^(k), k, n_t - 1, 2, -1) → list2Join({list2, list2a}) → list2sumSequence(Element[list1, n] * Element[list2sum, n], n, 1, n_t - 1) → list3uElement(list1, n_t) → h_cRemoveUndefined(Sequence[If[abs(Element[list1, n]) > 0, Element[list3u, n], ""], n, 1, n_t - 1]) → list3Length(list3) → n_{list3}Textfield(f) → inputBox1Textfield(p) → inputBox2Element(list1, 3) → cCoordinatePointeronAxisToolNew(P) → text2, text4, u, v, text5
AI Drawing Prompt Reference
Plot a quadratic function by calculating points individually to demonstrate the graphing process. Set coefficients based on the general form ax^2+bx+c, generate a series of points, and connect them to form the function's graph. Highlight the key coefficients and their impact on the graph, and use a coordinate pointer tool to select specific points on the axes, showing the intersection points of the function with the coordinate axes.
The prompt above was compiled from the original drawing commands and is for reference only.