
Plotting Points in 3D: Dynamic Illustrator
Loading the math board and drawing, please wait…
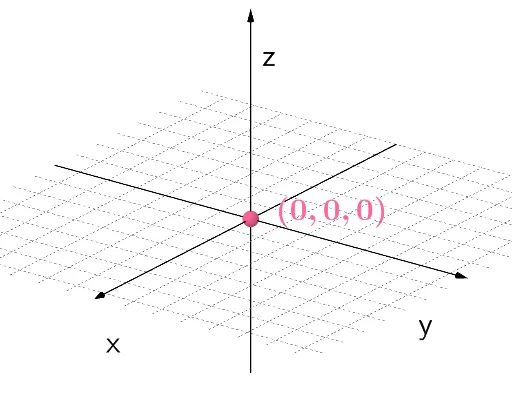
This example demonstrates how to plot points in 3-dimensional space dynamically. Key mathematical concepts include coordinates and vectors. Using commands like Intersect, Vector, and If, the position of points can be modified interactively. Suitable for high school and above students learning solid geometry.
GeoGebra Commands & Parameters
Intersect(yAxis, zAxis) → CVector(C, D) → uVector(D, E) → vVector(E, B) → wIf(c2, "y coordinate is correct.", "y coordinate is not correct.") → text3If(c1, "x coordinate is correct.", "x coordinate is not correct.") → text2If(c3, "z coordinate is correct.", "z coordinate is not correct.") → text4
AI Drawing Prompt Reference
Plot points dynamically in 3D space to demonstrate key concepts of coordinates and vectors. Start by plotting the intersection of two coordinate axes, then draw three vectors originating from this point, representing the x, y, and z directions. Dynamically display whether the x, y, and z coordinates are correct, with text annotations indicating the results.
The prompt above was compiled from the original drawing commands and is for reference only.