
Plotting 3D Surfaces
Loading the math board and drawing, please wait…
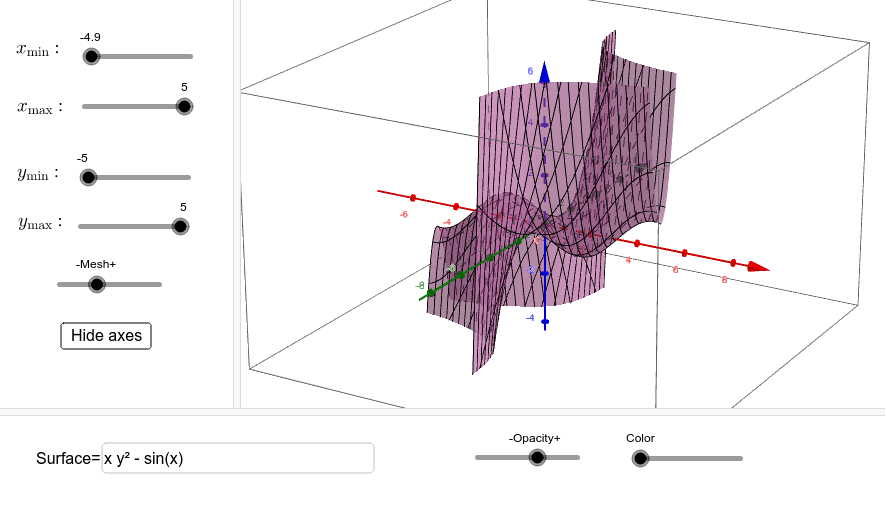
This example demonstrates how to plot a three-dimensional surface of the function f(x,y) over a specified domain, involving core math concepts like functions and surface plotting in calculus. It utilizes GeoGebra commands such as Function, Sequence, and Textfield, along with objects like f, x_{min}, x_{max}, y_{min}, y_{max}, g, a, list1, list2, b, c, InputBox1, text1, text2, text3, text4, axes, and button1 for construction. Ideal for high school and above students to understand function graphs and 3D geometry.
GeoGebra Commands & Parameters
Function(f, x_{min}, x_{max}, y_{min}, y_{max}) → gSequence(CurveCartesian[k, t, f(k, t), t, y_{min}, y_{max}], k, x_{min}, x_{max}, 1 / a) → list1Sequence(CurveCartesian[t, k, f(t, k), t, x_{min}, x_{max}], k, y_{min}, y_{max}, 1 / a) → list2Textfield(f) → InputBox1