
Plot Complex Solutions of Linear ODE Systems
Loading the math board and drawing, please wait…
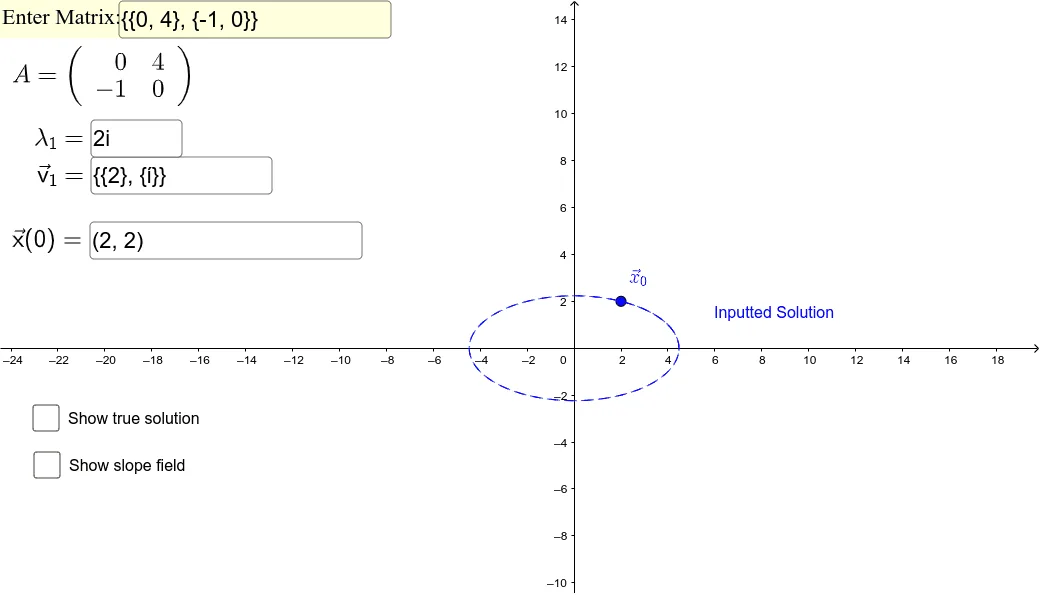
① This GeoGebra example demonstrates how to visualize the true solutions of a system of two linear ordinary differential equations with complex eigenvalues, given a user-input coefficient matrix and initial condition. ② Core mathematical concepts include linear ODE systems, complex eigenvalues, complex exponential solutions, phase-plane trajectories, and decomposition of solutions into real and imaginary parts. ③ Construction highlights: the SolveODE command computes numerical solutions, CurveCartesian plots parametric curves, SlopeField generates a direction field; matrix operations use Determinant, Identity, and Element; interactive inputs via Textfield and InputBox allow adjusting coefficients and initial values; the ComplexSoln object displays the analytic complex-form solution. ④ Suitable for university-level differential equations courses or advanced high-school enrichment, this tool helps learners grasp how complex eigenvalues produce spiral or oscillatory trajectories, and supports classroom demonstrations or self-guided exploration of parameter effects.
GeoGebra Commands & Parameters
Determinant(A) → detAIdentity(2) → ITextfield(A) → InputBox1Element(A, 1, 1) → aElement(A, 1, 2) → bElement(A, 2, 1) → cElement(A, 2, 2) → dTextfield(x0) → InputBox3Textfield(v1) → InputBox6SlopeField(((c * x) + (d * y)) / ((a * x) + (b * y)), 30, 0.5) → slopefield1SolveODE(v(x, y) / u(x, y), x(x0), y(x0), 30, 0.001) → ExactSolnTextfield(lambda1) → InputBox2CurveCartesian(((d1 * ℯ^((real(lambda1) * t))) * ((Element[alpha(1), 1] * cos((imaginary(lambda1) * t))) - (Element[bet(1), 1] * sin((imaginary(lambda1) * t))))) + ((d2 * ℯ^((real(lambda1) * t))) * ((Element[bet(1), 1] * cos((imaginary(lambda1) * t))) + (Element[alpha(1), 1] * sin((imaginary(lambda1) * t))))), ((d1 * ℯ^((real(lambda1) * t))) * ((Element[alpha(2), 1] * cos((imaginary(lambda1) * t))) - (Element[bet(2), 1] * sin((imaginary(lambda1) * t))))) + ((d2 * ℯ^((real(lambda1) * t))) * ((Element[bet(2), 1] * cos((imaginary(lambda1) * t))) + (Element[alpha(2), 1] * sin((imaginary(lambda1) * t))))), t, 0, 10) → ComplexSoln
AI Drawing Prompt Reference
Plot the solution of a system of two linear ordinary differential equations with user-input coefficients and initial conditions. First, draw the slope field, then compute and plot the exact solution. Next, decompose the solution into real and imaginary parts based on the eigenvalues, and plot the trajectory of the complex solution.
The prompt above was compiled from the original drawing commands and is for reference only.