
Piecewise Functions by Dr. Doug Davis, 3D
Loading the math board and drawing, please wait…
In collections
Fun with Functions
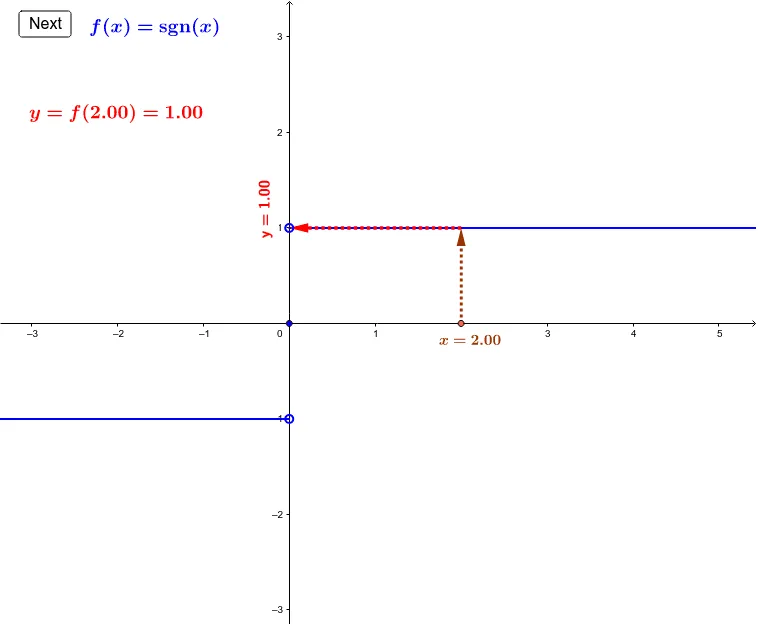
This applet demonstrates several piecewise functions to show how the y value changes as the x value moves between pieces. Key mathematical concepts include piecewise functions. It uses GeoGebra commands such as Point, Element, Vector, VerticalText, Defined, and Textfield. Suitable for high school mathematics education.
GeoGebra Commands & Parameters
Point(xAxis) → SplitPointElement(flist, nf) → gPoint(xAxis) → AVector(A, B) → uVector(B, C) → vVerticalText(text5) → text6Defined(fxa) → fcnDefinedTextfield(f_6) → inputBox1Textfield(f_7) → inputBox2
AI Drawing Prompt Reference
Draw a 3D coordinate system illustrating a piecewise function. Place a movable split point on the x-axis to separate different function intervals. Choose a current x-value on the x-axis, and draw a vector arrow from this point to the corresponding point on the function graph, then another vector arrow from that graph point to the y-axis projection, showing how y changes with x. Add vertical text labeling the current piece, and include two input boxes: one for the piece expression and one for the function value. If the function is undefined at a point, show a text note. Keep the layout clear for high school math teaching.
The prompt above was compiled from the original drawing commands and is for reference only.