
Piecewise Constant Function Graph: Visualizing Domain and Range
Loading the math board and drawing, please wait…
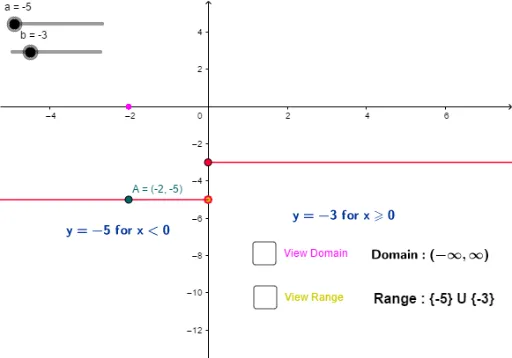
This example demonstrates a piecewise function composed of two constant functions, showing how the function takes fixed values on different intervals of its domain. It clearly visualizes the domain and range of the piecewise function, making it easy to understand the concept of piecewise-defined functions. Core mathematical concepts include piecewise functions, constant functions, domain, range, and function graphing. The construction uses GeoGebra commands such as Point to create key points, and objects like f, a, b, B, g, A, D, A1, C to define the function expressions and auxiliary points, along with text objects (text1, text2, text3, text4) to label intervals and function values. This example is suitable for middle school or high school students learning about functions, piecewise definitions, and domain/range analysis, as well as for college preparatory review.
GeoGebra Commands & Parameters
Point(g) → A
AI Drawing Prompt Reference
Draw the graph of a piecewise constant function, showing how the function takes fixed values over different intervals, with points marking key positions, and label the intervals and function values to clearly present the domain and range of the piecewise function, aiding in understanding the concept of piecewise-defined functions.
The prompt above was compiled from the original drawing commands and is for reference only.