
Pie Chart Creation and Mathematical Application
Loading the math board and drawing, please wait…
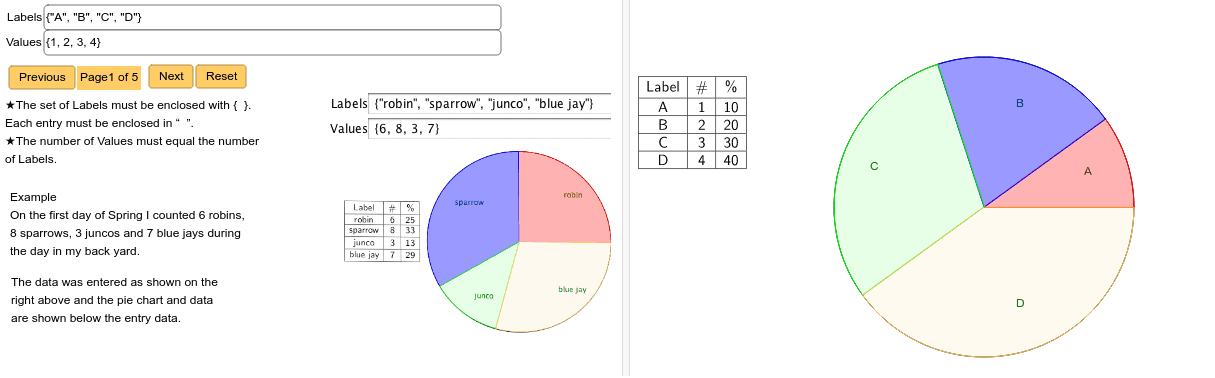
This example demonstrates how to create a pie chart using GeoGebra and helps students understand the importance of data visualization in mathematics. Key mathematical concepts include frequency distribution, equations, and real numbers. Construction involves commands like Sum, Join, Sequence and objects such as Values, Sector. Suitable for middle school or high school students for mathematical practice and data analysis learning.
GeoGebra Commands & Parameters
Sum(Values) → smJoin({{0}, Sequence[Sum[Angle, k], k, 1, Length[Angle]]}) → SumAngSequence((Element[SumAng, k] + Element[SumAng, k + 1]) / 2, k, 1, Length[SumAng] - 1) → AmidptSequence(If[π / 2 < Element[Amidpt, k] < (3 * π / 2), 2.4, 2.1], k, 1, Length[Amidpt]) → list4Textfield(Labels) → inputBox1Textfield(Values) → inputBox2Sequence(Sector[c, Element[SumAng, k], Element[SumAng, k + 1]], k, 1, Length[SumAng] - 1) → list1Element(list1, 1) → Sector1Element(list1, 2) → Sector2Element(list1, 3) → Sector3Element(list1, 4) → Sector4Element(list1, 5) → Sector5Element(list1, 6) → Sector6Element(list1, 7) → Sector7Element(list1, 8) → Sector8Element(list1, 9) → Sector9Element(list1, 10) → Sector10Sequence(((Element[list4, k] * cos(Element[Amidpt, k])), (Element[list4, k] * sin(Element[Amidpt, k]))), k, 1, Length[Amidpt]) → list_{points}Sequence(Text[Element[Labels, k], Element[list_{points}, k]], k, 1, Length[list_{points}]) → list3TableText({Join[{{"Label"}, Labels}], Join[{{"#"}, Values}], Join[{{"%"}, (100 * DecPart)}]}, "c_|v") → text1
AI Drawing Prompt Reference
Create a pie chart with multiple sectors. First, calculate the sum of angles (SumAng). Then, calculate the average angle (Amidpt). Generate labels based on the average (list4). Create sectors and calculate the center points of each sector (list_{points}). Finally, add text labels and text boxes (Textfield, TableText). Ensure the chart is clear and labels are aligned.
The prompt above was compiled from the original drawing commands and is for reference only.