
Pie Chart Construction
Loading the math board and drawing, please wait…
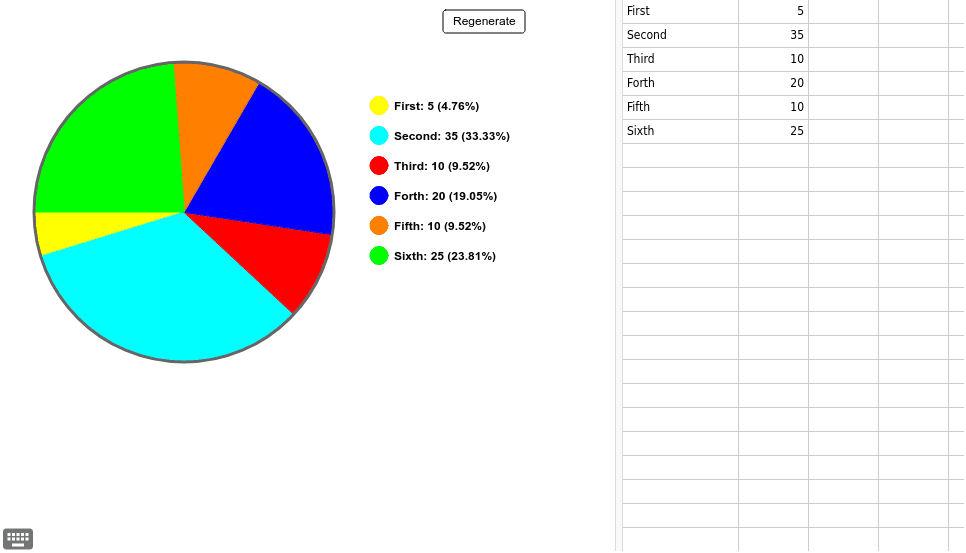
This example demonstrates how to create a pie chart in GeoGebra. It involves concepts such as proportions and angles. Commands used include Circle, Length, Zip, Sequence, and CircleSector. Suitable for middle school and above students to learn data representation and statistics.
GeoGebra Commands & Parameters
Circle(PieMidpoint, PieRadius) → PieCircleLength(data) → nZip(Element[A, 2], A, data) → data_{prep}Sequence(Sum[data_{prep}, i], i, 1, n) → data_{sum}Sequence(Point[PieCircle, Element[data_{sum}, i] / Element[data_{sum}, n]], i, 1, n) → PiePointsSequence(Text[Element[data, i, 1] + ": " + (Element[data, i, 2]) + " (" + (Element[data, i, 2] / Element[data_{sum}, n] * 100) + "%)", LegendTopLeft - ((-LegendSpacing) / 2, (i - 1) * LegendSpacing)], i, 1, n) → LegendLabelsCircleSector(PieMidpoint, Element[PiePoints, 6], Element[PiePoints, 1]) → sector_{1}Circle(LegendTopLeft - (0, -0.1499999999999999 * LegendSpacing), LegendSpacing * 0.3) → sector_{1}cCircleSector(PieMidpoint, Element[PiePoints, 1], Element[PiePoints, 2]) → sector_{2}Circle(LegendTopLeft - (0, 0.8500000000000001 * LegendSpacing), LegendSpacing * 0.3) → sector_{2}cCircleSector(PieMidpoint, Element[PiePoints, 2], Element[PiePoints, 3]) → sector_{3}Circle(LegendTopLeft - (0, 1.85 * LegendSpacing), LegendSpacing * 0.3) → sector_{3}cCircleSector(PieMidpoint, Element[PiePoints, 3], Element[PiePoints, 4]) → sector_{4}Circle(LegendTopLeft - (0, 2.85 * LegendSpacing), LegendSpacing * 0.3) → sector_{4}cCircleSector(PieMidpoint, Element[PiePoints, 4], Element[PiePoints, 5]) → sector_{5}Circle(LegendTopLeft - (0, 3.85 * LegendSpacing), LegendSpacing * 0.3) → sector_{5}cCircleSector(PieMidpoint, Element[PiePoints, 5], Element[PiePoints, 6]) → sector_{6}Circle(LegendTopLeft - (0, 4.85 * LegendSpacing), LegendSpacing * 0.3) → sector_{6}c
AI Drawing Prompt Reference
Create a pie chart to represent a set of data. Start by drawing a circle as the base of the pie chart. Then, calculate the angle for each sector based on the proportion of the data. Draw six sectors sequentially, each representing a category in the data. Add labels next to each sector to show the data value and percentage.
The prompt above was compiled from the original drawing commands and is for reference only.