
Gershgorin Circle Theorem: Eigenvalue Localization for Square Matrices
Loading the math board and drawing, please wait…
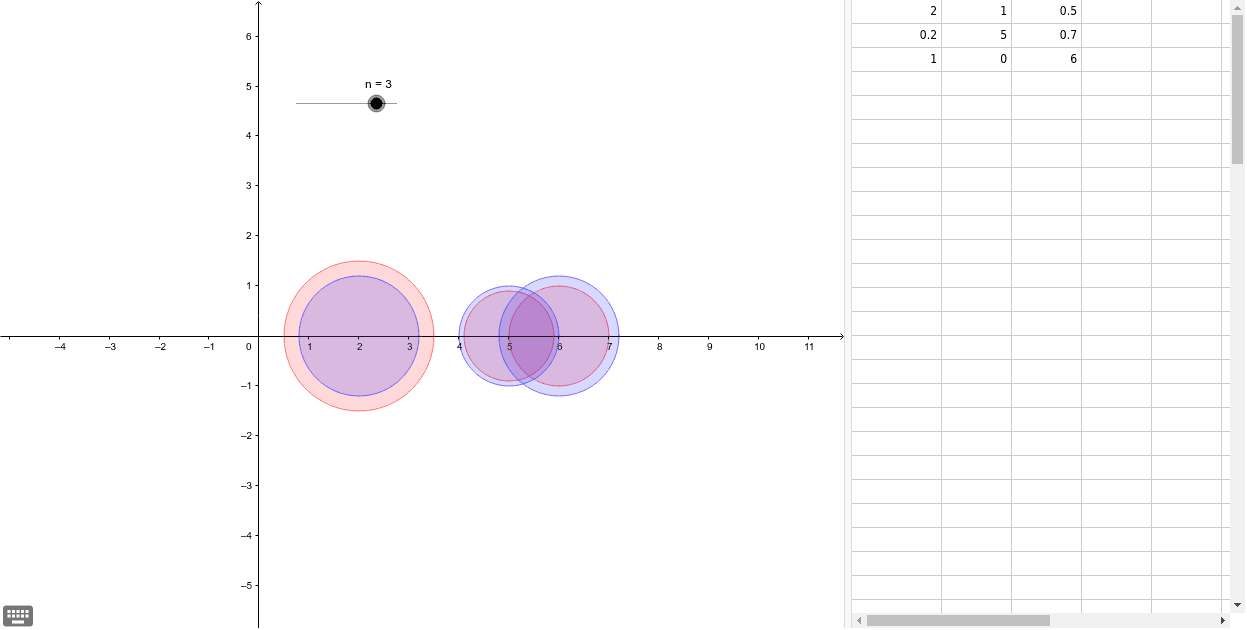
This GeoGebra example demonstrates the Gershgorin circle theorem for square matrices. It visualizes Gershgorin discs—circles centered at diagonal entries of a matrix with radii equal to the sum of absolute values of off-diagonal entries in each row—showing that all eigenvalues of the matrix lie within the union of these discs. Core mathematical concepts include square matrices, diagonal and off-diagonal entries, absolute values, eigenvalue localization, and the Gershgorin circle theorem from linear algebra. The construction uses the GeoGebra Sequence command to generate a collection of circle objects (circs, circs_t), supported by point objects A1, A2, A3, B1, B2, B3, C1, C2, C3 and variables n, sum, sum_t to compute centers and radii dynamically. Suitable for university-level linear algebra courses, matrix analysis, and self-study, this interactive visualization helps learners understand eigenvalue bounds and matrix properties through geometric representation.
GeoGebra Commands & Parameters
Sequence(Sum[Sequence[If[i ≠ j, abs(Cell[i, j]), 0], j, 1, n]], i, 1, n) → sum_tSequence(Sum[Sequence[If[i ≠ j, abs(Cell[j, i]), 0], j, 1, n]], i, 1, n) → sumSequence(Circle[(Cell[i, i], 0), Element[sum, i]], i, 1, n) → circsSequence(Circle[(Cell[i, i], 0), Element[sum_t, i]], i, 1, n) → circs_t
AI Drawing Prompt Reference
Visualize the Gershgorin Circle Theorem for a matrix by drawing circles centered at diagonal entries with radii equal to the sum of absolute off-diagonal entries in each row, using distinct colors for original and adjusted radii to show that all eigenvalues lie within the union of these circles.
The prompt above was compiled from the original drawing commands and is for reference only.