
Pie Chart by VINOTH
Loading the math board and drawing, please wait…
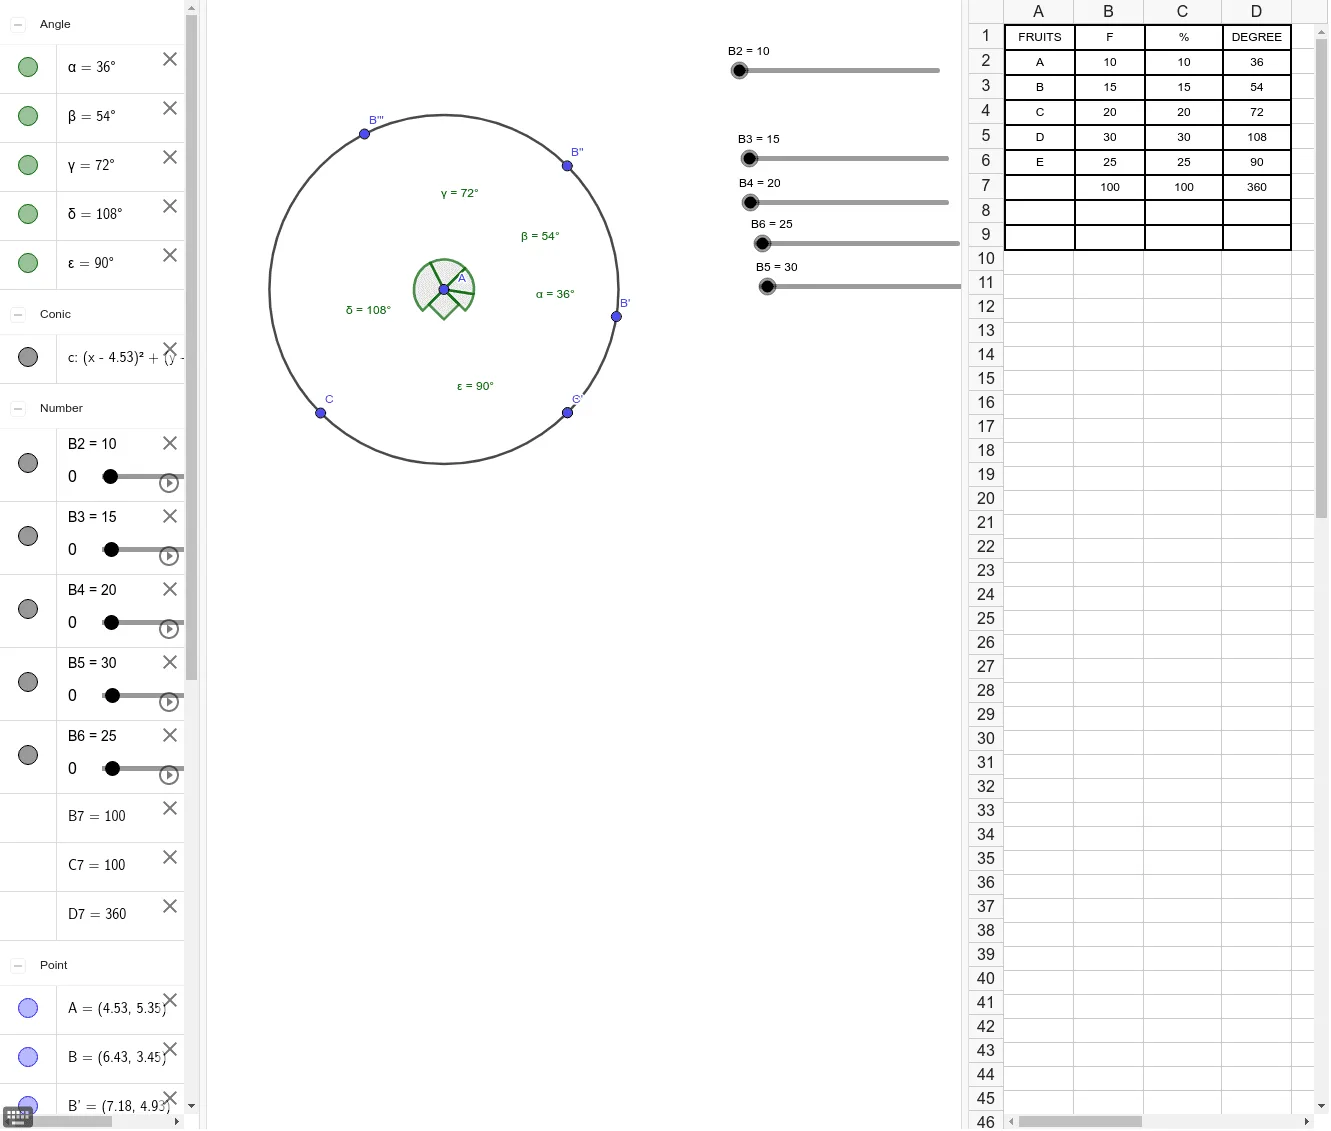
This example demonstrates the construction of a pie chart. Key mathematical concepts include angles and properties of circles. Using GeoGebra commands such as Sum, Circle, and Rotate, a dynamic pie chart can be created. Suitable for middle school and above students to learn data statistics and chart drawing.
GeoGebra Commands & Parameters
Sum(B2:B6) → B7Sum(D2:D4) → aSum(C2:C6) → C7Sum(D2:D6) → D7Circle(A, B) → cRotate(B, D2°, A) → B'Angle(B, A, B') → αRotate(B', D3°, A) → B''Angle(B', A, B'') → βRotate(B'', D4°, A) → B'''Angle(B'', A, B''') → γRotate(B''', D5°, A) → CAngle(B''', A, C) → δRotate(C, D6°, A) → C'Angle(C, A, C') → ε