
Pi and 5: Vectors, Tangents, and Quadratic Functions in GeoGebra
Loading the math board and drawing, please wait…
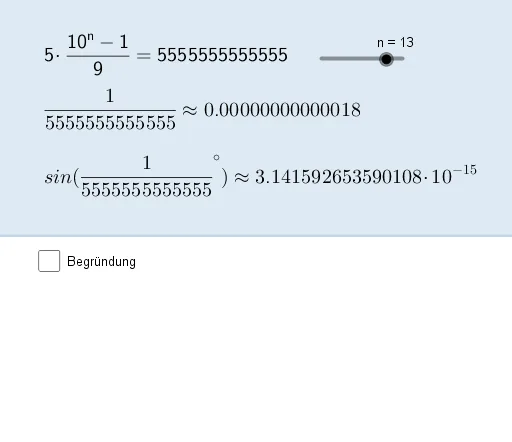
This GeoGebra example dynamically illustrates the geometric and algebraic relationship between the mathematical constant π and the number 5, integrating vectors, tangents, quadratic functions, and probability distributions. The core construction involves a two-dimensional vector scenario where sliders n, a, and k control key parameters, while text objects Text1 through Text5 display real-time numerical values. A tangent line s and a quadratic function are plotted to visually connect π's approximation with the value 5. Key construction steps include using GeoGebra commands to create points, vectors, tangent lines, and function graphs, with sliders enabling dynamic parameter adjustments to observe changes in the figure and outputs. This resource is suitable for high school and above students exploring mathematical constants through interactive geometry, and serves as a classroom demonstration tool for approximating π and analyzing composite functions.
GeoGebra Commands & Parameters
Numeric n(13.0)(5 * (10^(n) - 1) / 9)1 / asin(k°)Boolean b(false)c(y) = y ≥ 0