
Perimeter Calculation & Polygon Demo
Loading the math board and drawing, please wait…
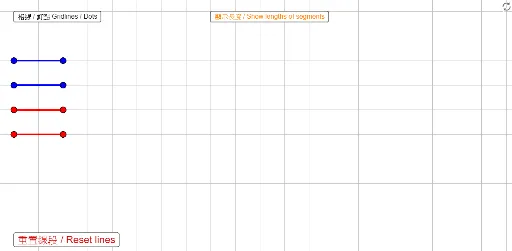
This example demonstrates how to construct and calculate the perimeter of polygons, particularly rectangles and general polygons, using GeoGebra. Key math concepts include perimeter calculation, coordinate geometry, sequence application, and expected value in Poisson distribution. The construction leverages commands like Segment and Sequence, along with objects such as ShowDots and buttonGridDot for dot display and interaction. Suitable for high school students learning geometric construction, probability statistics, and mathematical modeling to understand complex polygon perimeters and random distribution models.
GeoGebra Commands & Parameters
Segment(Blue1a, Blue1b) → Blue1Segment(Blue2a, Blue2b) → Blue2Segment(Blue3a, Blue3b) → Blue3Segment(Blue4a, Blue4b) → Blue4Segment(Red1a, Red1b) → Red1Segment(Red2a, Red2b) → Red2Segment(Red3a, Red3b) → Red3Segment(Red4a, Red4b) → Red4Segment(Blue5a, Blue5b) → Blue5Segment(Red5a, Red5b) → Red5Segment(Blue6a, Blue6b) → Blue6Segment(Red6a, Red6b) → Red6Sequence(Sequence[(s, t), s, 0, 25], t, -5, 13) → ListDotsSegment(Blue7a, Blue7b) → Blue7Segment(Blue8a, Blue8b) → Blue8Segment(Blue9a, Blue9b) → Blue9Segment(Blue10a, Blue10b) → Blue10Segment(Blue11a, Blue11b) → Blue11Segment(Blue12a, Blue12b) → Blue12Segment(Red7a, Red7b) → Red7Segment(Red8a, Red8b) → Red8Segment(Red9a, Red9b) → Red9Segment(Red10a, Red10b) → Red10Segment(Red11a, Red11b) → Red11Segment(Red12a, Red12b) → Red12
AI Drawing Prompt Reference
Create a diagram that shows a rectangle outlined in blue and an irregular polygon outlined in red, illustrating perimeter calculations for both shapes. Include a grid of evenly spaced dots scattered across the plane to represent coordinate points, which can be used to demonstrate how perimeters are measured and how points relate to probability distributions. Start by drawing the blue rectangle, then add the red polygon, and finally place the grid of dots. The visual should clearly distinguish the two shapes’ edges and the point set, making it easy to see how the segments form the boundaries and how the dots can be used in statistical modeling.
The prompt above was compiled from the original drawing commands and is for reference only.