
Percentages: Selling Problems, Profit & Loss
Loading the math board and drawing, please wait…
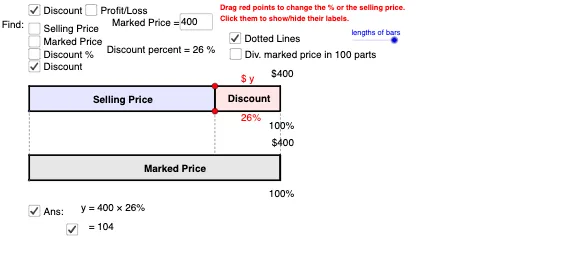
This example demonstrates percentage calculations in sales problems, focusing on profit and loss computation. Core mathematical concepts include percentage calculation, profit margin, loss percentage, and basic geometric construction. Key GeoGebra commands used are Point, Polygon, Intersect, Sequence, Textfield, Midpoint, If, and Segment. The construction involves creating geometric shapes, generating data sequences, applying conditional logic for changes, and drawing lines and segments. Suitable for middle school or high school mathematics education, it helps students understand practical applications of percentages and geometric drawing.
GeoGebra Commands & Parameters
Point(yAxis) → APoint(yAxis) → BPoint(Segment[A, A + ((length * maxchange), 0)]) → PPoint(Segment[A + (0, width), A + ((length * maxchange), width)]) → QPolygon(A, P, P + (0, width), A + (0, width)) → poly1, poly1a, poly1d, poly1b, poly1cPolygon(B, B + (length, 0), B + (length, width), B + (0, width)) → poly2, poly2b, poly2a, poly2c, poly2dIntersect(Ray[P, P + (1, 0)], x = length) → A1Intersect(Ray[Q, Q + (1, 0)], x = length) → A2Intersect(Ray[B1, B1 + (1, 0)], x = x(P)) → P'Intersect(Ray[B2, B2 + (1, 0)], x = x(P)) → Q'Polygon(P, Q, A2, A1) → poly3, poly3b, poly3b_1, poly3d, poly3cPolygon(B1, B2, Q', P') → poly4, poly4c, poly4d, poly4b, poly4aSequence(Segment[B + ((i * length / 10), 0), B + ((i * length / 10), width)], i, 1, 9) → list1Sequence(Sequence[Segment[B + ((j * length / 100) + (i * length / 10), 0), B + ((j * length / 100) + (i * length / 10), width)], j, 1, 9], i, 0, 9) → list2Sequence(Segment[A + ((i * length / 10), 0), A + ((i * length / 10), width)], i, 1, 9) → list3Sequence(Sequence[Segment[A + ((j * length / 100) + (i * length / 10), 0), A + ((j * length / 100) + (i * length / 10), width)], j, 1, 9], i, 0, 9) → list4Textfield(cost) → inputBox1Textfield(cost) → inputBox2Midpoint(B, B2) → CMidpoint(A, Q) → DMidpoint(P, A2) → EMidpoint(B1, Q') → FMidpoint(B1, Q') → GTextfield(price) → inputBox3Midpoint(P, A1) → HMidpoint(poly4a) → IMidpoint(poly3b_1) → JMidpoint(poly4d) → KIf(o_2, "$ y", "$" + cost) → text9If(o_2, "$ y", "$" + cost) → text4If(o_3, "y %", (abs(change_%) * "%")) → text11If(o_1, "$ y", "$" + price) → text13If(change_% < 0, "-", "+") → text24If(o_3, "y %", (abs(change_%) * "%")) → text17If(o_3, (("1 " * text24) * " y %"), "1 " + ((((text24 * " ") * abs(change_%)) * "%"))) → text34If(o_3, (("1 " * text24) * " y %"), "1 " + ((((text24 * " ") * abs(change_%)) * "%"))) → text14If(o_1 ∨ o_4, If[o_1, "$ y", (((cost * " ") * text24) * " $ y")], "$" + price) → text12If(o_4, (((cost * " ") * text24) * " $ y"), "$" + price) → text15Textfield(price) → inputBox4Segment(B + (0, width), A) → gSegment(B2, A + (length, 0)) → iSegment(P, If[x(P) < length, Intersect[poly2c, x = x(P)], Intersect[poly4d, x = x(P)]]) → hSequence(Segment[A + ((i * length / 10), 0), A + ((i * length / 10), width)], i, 1, floor((x(P) / length * 10))) → list3_1Sequence(Sequence[Segment[A + ((j * length / 100) + (i * length / 10), 0), A + ((j * length / 100) + (i * length / 10), width)], j, 1, 9], i, 0, floor((x(P) / length * 10)) - 1) → list4_1Sequence(Segment[B + ((i * length / 10), 0), B + ((i * length / 10), width)], i, 1, floor((x(P) / length * 10))) → list5Sequence(Sequence[Segment[B + ((j * length / 100) + (i * length / 10), 0), B + ((j * length / 100) + (i * length / 10), width)], j, 1, 9], i, 0, floor((x(P) / length * 10)) - 1) → list6_1Sequence(Segment[A + ((j * length / 100) + (floor((x(P) / length * 10)) * length / 10), 0), A + ((j * length / 100) + (floor((x(P) / length * 10)) * length / 10), width)], j, 1, floor(((x(P) - (floor((x(P) / length * 10)) * length / 10)) / length * 100))) → list4_2Sequence(Segment[B + ((j * length / 100) + (floor((x(P) / length * 10)) * length / 10), 0), B + ((j * length / 100) + (floor((x(P) / length * 10)) * length / 10), width)], j, 1, floor(((x(P) - (floor((x(P) / length * 10)) * length / 10)) / length * 100))) → list6_2If(b ∧ change_% < 0, "Loss", "Discount") → text8If(b, "Cost", "Marked Price") → text6
AI Drawing Prompt Reference
Draw a rectangular area divided into two parts, one for cost and the other for price. In the cost part, draw a series of vertical segments to represent cost changes, and in the price part, draw a series of vertical segments to represent price changes. Draw two diagonal lines between the two rectangles to represent the conversion relationship between cost and price. Draw some auxiliary line segments inside the rectangles to indicate the range of cost and price changes. Add text boxes on the rectangles to input specific values for cost and price.
The prompt above was compiled from the original drawing commands and is for reference only.