
Paths on a Torus versus Paths on a Sphere
Loading the math board and drawing, please wait…
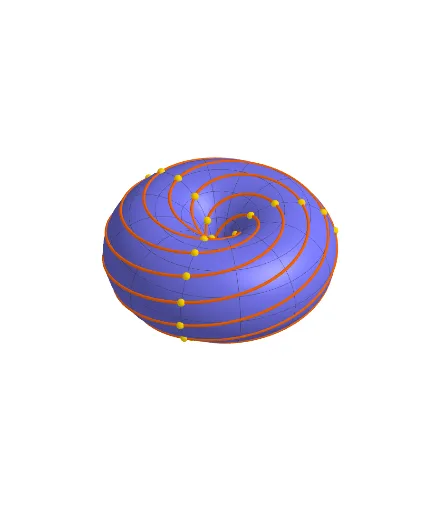
This interactive 3D visualization contrasts paths drawn on a torus with those on a sphere, highlighting how the topology of a surface influences the shape and behavior of curves. The core mathematical concepts include parametric surfaces, space curves, curvature, and the topological notion of genus. The construction uses GeoGebra commands such as CurveCartesian to define parametric paths, Surface to create the torus and sphere, Point to mark key locations, and Sequence to generate a series of points along the paths. Sliders (e.g., α, p, q, R, r) allow dynamic adjustment of path parameters and surface dimensions, enabling exploration of how changes affect the curves. This example is suitable for high school to undergraduate mathematics, particularly in analytic geometry, calculus, or introductory topology, helping students visualize and compare geodesic-like paths on surfaces with different curvature and connectivity.
GeoGebra Commands & Parameters
CurveCartesian(((((r + d) * cos((q * t) + β)) + (R * (d - 1))) * cos((p * t) + β)), ((((r + d) * cos((q * t) + β)) + (R * (d - 1))) * sin((p * t) + β)), ((-(r + d)) * sin((q * t) + β)), t, 0, α) → cPoint(c) → ASurface((((R * (d - 1)) + ((r + d) * cos(u))) * cos(v)), (((R * (d - 1)) + ((r + d) * cos(u))) * sin(v)), ((r + d) * sin(u)), u, 0, 6.28319, v, 0, 6.28319) → eSequence((((((r + d) * cos((q * t) + β)) + (R * (d - 1))) * cos((p * t) + β)), ((((r + d) * cos((q * t) + β)) + (R * (d - 1))) * sin((p * t) + β)), ((-(r + d)) * sin((q * t) + β))), t, 0, α, 10°) → l1
AI Drawing Prompt Reference
Create a 3D comparison scene with a torus on the left and a sphere on the right, both shown as semi-transparent wireframe surfaces. On the torus, a colored space curve winds around its surface, defined by parametric equations that depend on the torus's major and minor radii and winding numbers. On the sphere, another curve follows a great-circle-like path. Both surfaces have a sequence of small points marking the curve's positions along the path. Use sliders to adjust the curve's winding counts, torus dimensions, and starting angle, allowing exploration of how the curve shapes differ due to surface topology.
The prompt above was compiled from the original drawing commands and is for reference only.