
Parametric Trigonometry Graph
Loading the math board and drawing, please wait…
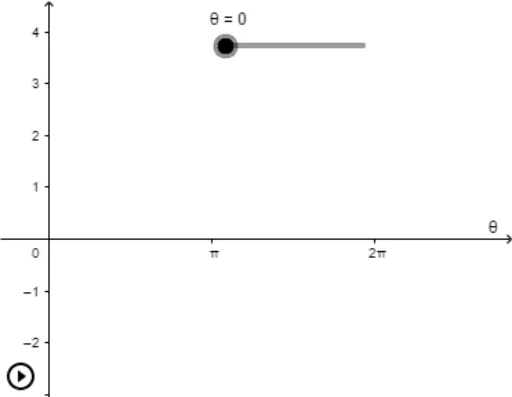
This example dynamically draws a trigonometric graph using parametric equations, illustrating how parameter changes affect the curve's shape. Core mathematical concepts include parametric equations, trigonometric functions (sine, cosine), and the relationship between parameter θ and coordinates x, y. The construction uses GeoGebra's CurveCartesian command with θ as the parameter and a as a control variable to generate the curve locus. Suitable for high school or early college students to understand the connection between parametric equations and trigonometric graphs, and for teachers as a classroom demonstration tool to explore periodicity and amplitude variations dynamically.
GeoGebra Commands & Parameters
CurveCartesian(k, (2 * sin(k)), k, 0, θ) → a