
Parallel Boxplots
Loading the math board and drawing, please wait…
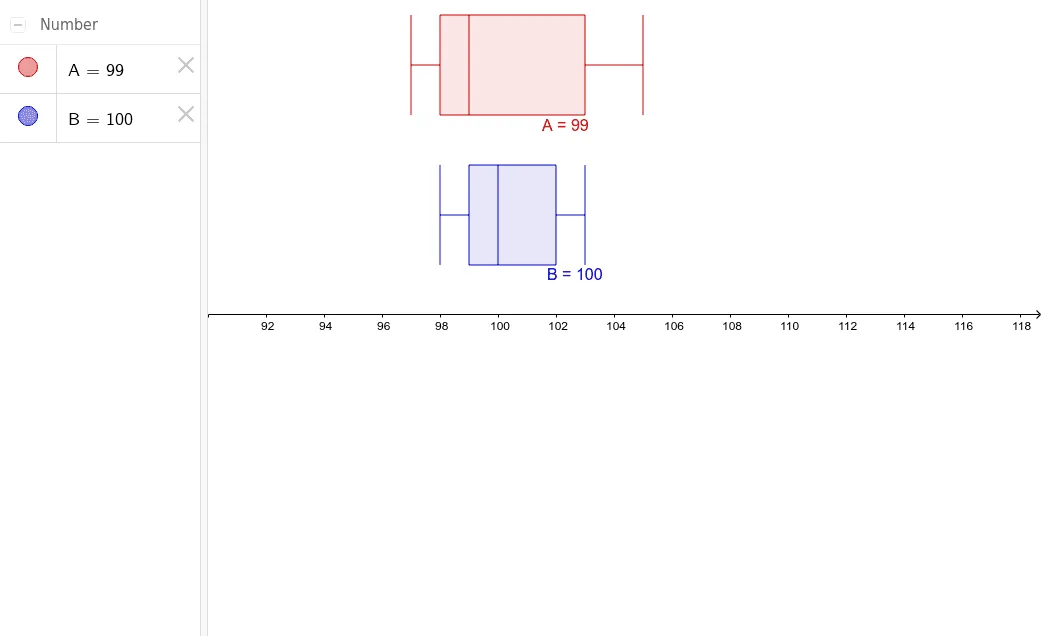
This example demonstrates how to create parallel boxplots using GeoGebra, a statistical chart used to compare the distributions of different datasets. Key mathematical concepts include the components of a boxplot, such as the median and quartiles. The BoxPlot command is used to quickly generate boxplots for the datasets.
GeoGebra Commands & Parameters
BoxPlot(5, 1, {97, 98, 98, 99, 103, 103, 105}) → ABoxPlot(2, 1, {98, 99, 99, 100, 102, 102, 103}) → B
AI Drawing Prompt Reference
Draw parallel boxplots for two datasets, each containing 7 values: one dataset is 97, 98, 98, 99, 103, 103, 105, and the other is 98, 99, 99, 100, 102, 102, 103. The boxplots should display medians and quartiles to compare the distributions of the two datasets.
The prompt above was compiled from the original drawing commands and is for reference only.