
Parallel Boxplot Construction Attempt
Loading the math board and drawing, please wait…
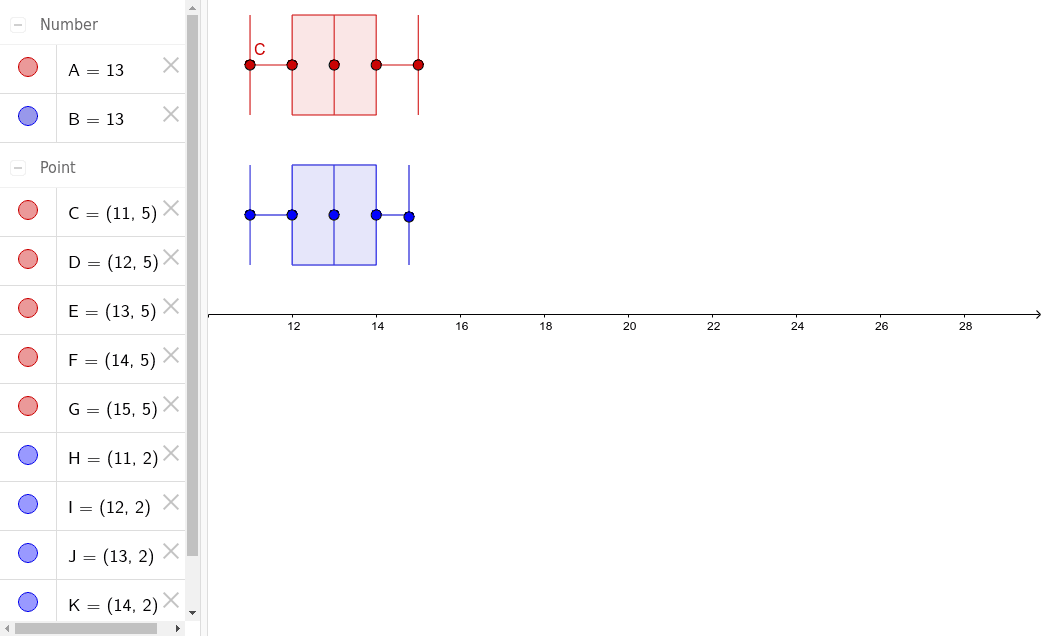
This example demonstrates how to construct parallel boxplots in GeoGebra to compare the distribution characteristics of different datasets. Key math concepts include data distribution, five-number summary (min, Q1, median, Q3, max), and boxplot drawing methods. The construction uses the BoxPlot command with objects C, D, E, F, G, H, I, J, K, L, A, B. Suitable for high school statistics education, helping students understand the application of data visualization tools.
GeoGebra Commands & Parameters
BoxPlot(5, 1, {x(C), x(D), x(D), x(E), x(F), x(F), x(G)}) → ABoxPlot(2, 1, {x(H), x(I), x(I), x(J), x(K), x(K), x(L)}) → B