
Parallel Boxplots Example
Loading the math board and drawing, please wait…
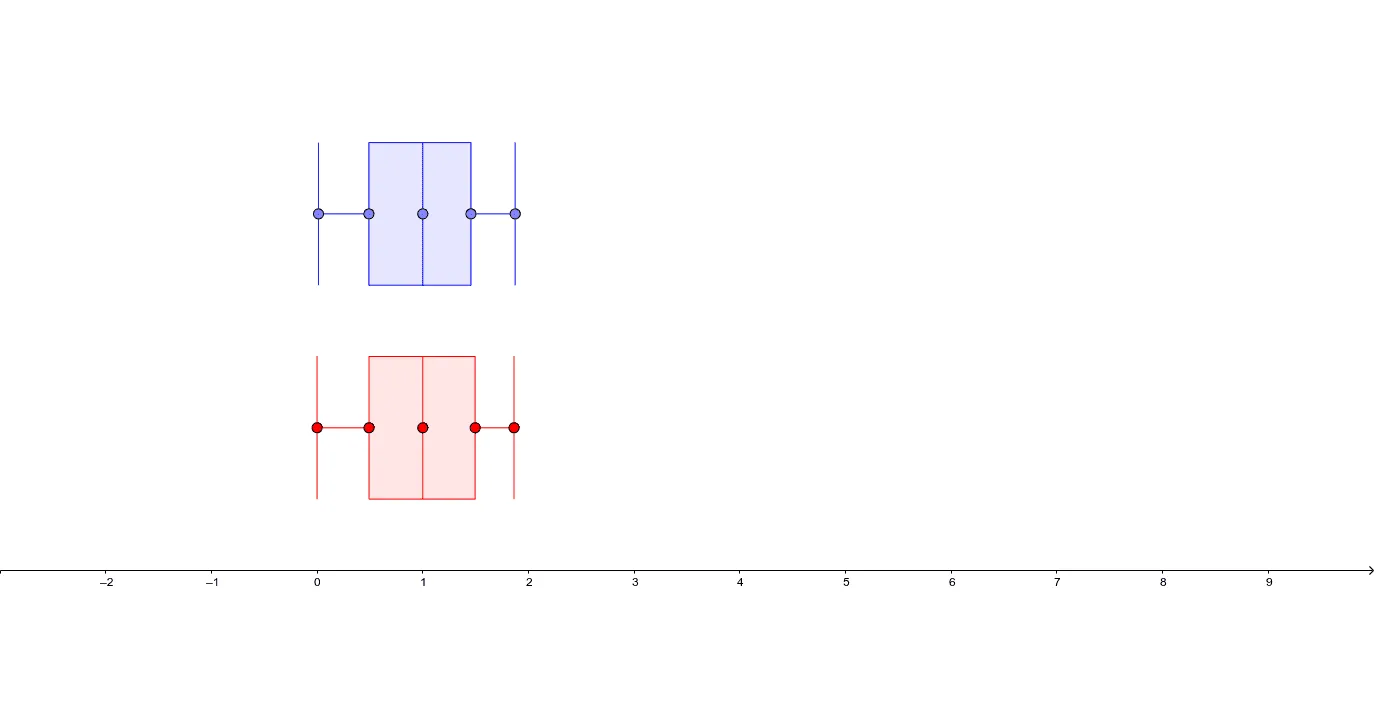
This example demonstrates how to use GeoGebra to create parallel boxplots for comparing the distribution characteristics of different datasets. It involves core mathematical concepts such as boxplots, logarithmic transformations, polygon constructions, geometric mean, and translation. The construction uses commands like Point and BoxPlot. Suitable for high school and above students for understanding data visualization and statistical analysis.
GeoGebra Commands & Parameters
Point(y = 5) → A1Point(Ray[A1, A1 + (1, 0)]) → A2Point(Ray[A2, A2 + (1, 0)]) → A3Point(Ray[A3, A3 + (1, 0)]) → A4Point(Ray[A4, A4 + (1, 0)]) → A5BoxPlot(5, 1, x(A1), x(A2), x(A3), x(A4), x(A5)) → bPoint(y = 2) → B1Point(Ray[B1, B1 + (1, 0)]) → B2Point(Ray[B2, B2 + (1, 0)]) → B3Point(Ray[B3, B3 + (1, 0)]) → B4Point(Ray[B4, B4 + (1, 0)]) → B5BoxPlot(2, 1, x(B1), x(B2), x(B3), x(B4), x(B5)) → a
AI Drawing Prompt Reference
Draw two horizontal rays, one starting at y=5 and the other at y=2, extending to the right. Mark five equally spaced points on each ray. Plot parallel boxplots using the x-coordinates of these points, one group for the points on the y=5 ray and another for the y=2 ray, to compare the distributions of the two datasets.
The prompt above was compiled from the original drawing commands and is for reference only.