
First Attempt at Parallel Boxplots
Loading the math board and drawing, please wait…
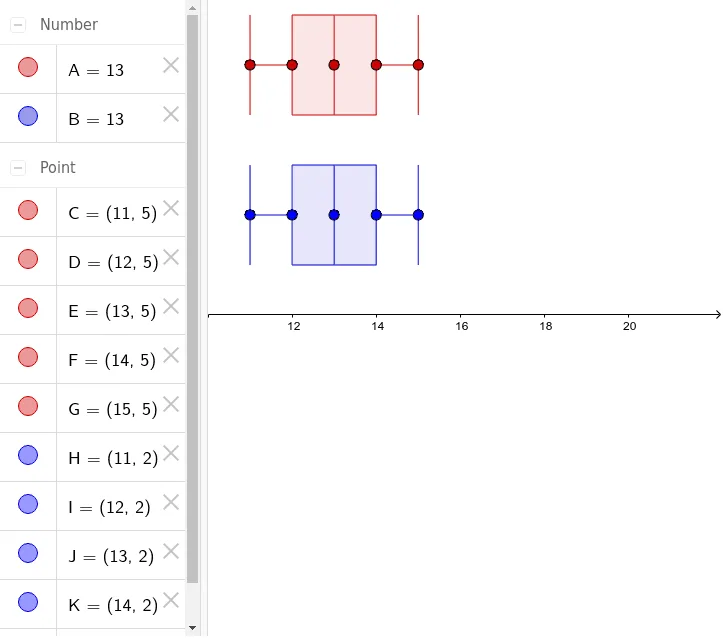
This example demonstrates the creation of parallel boxplots, a statistical chart used to display the distribution of a dataset. Parallel boxplots allow for the comparison of multiple datasets. The example uses the BoxPlot command in GeoGebra to create the boxplots. Suitable for middle school and above students or teachers to understand data distribution and statistical analysis.
GeoGebra Commands & Parameters
BoxPlot(2, 1, {11, 12, 12, 13, 14, 14, 15}) → BBoxPlot(5, 1, {11, 12, 12, 13, 14, 14, 15}) → A
AI Drawing Prompt Reference
Create a parallel boxplot chart showing two boxplots for the same dataset. Place the first boxplot on the left and the second on the right, aligned vertically with equal box heights. Each boxplot represents the distribution of the values 11, 12, 12, 13, 14, 14, 15, displaying the minimum, lower quartile, median, upper quartile, and maximum. Use rectangular boxes with a line for the median and whiskers extending to the extremes. Leave a gap between the two boxplots for clear comparison. Keep the chart simple with clear axes, suitable for teaching statistical distribution.
The prompt above was compiled from the original drawing commands and is for reference only.