
Mode on Different Lines by Kelly
Loading the math board and drawing, please wait…
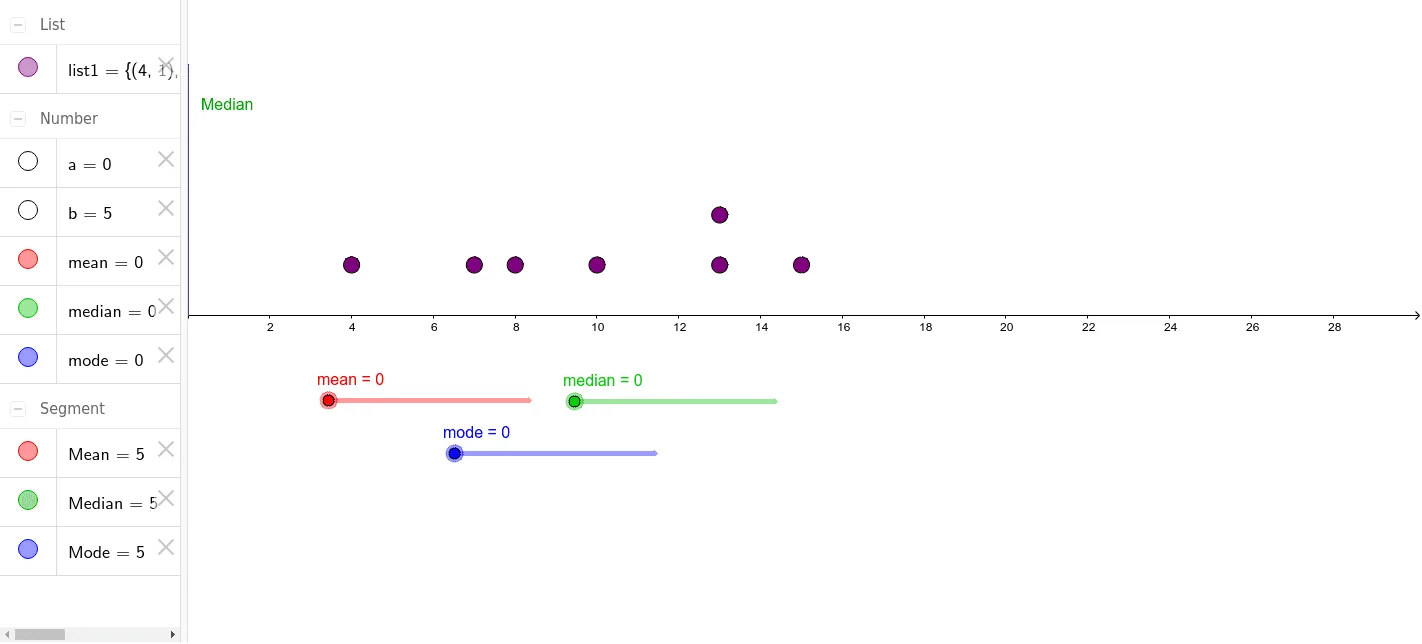
This example demonstrates how to find the mode on different lines. Key mathematical concepts include mode, data distribution, and point positions on a line. Using GeoGebra commands such as Segment and DotPlot, one can visually understand how to calculate the mode. Suitable for middle school and above students to learn data statistics and geometric construction.
GeoGebra Commands & Parameters
Segment((mean, a), (mean, b)) → MeanSegment((median, a), (median, b)) → MedianDotPlot({4, 7, 8, 10, 13, 13, 15}) → list1Segment((mode, a), (mode, b)) → Mode
AI Drawing Prompt Reference
Create a dot plot for the data set 4, 7, 8, 10, 13, 13, 15. Then draw vertical segments for the median, mean, and mode, extending upwards from the corresponding points on the x-axis.
The prompt above was compiled from the original drawing commands and is for reference only.