
Parabola with Table of Values by Michael Borcherds
Loading the math board and drawing, please wait…
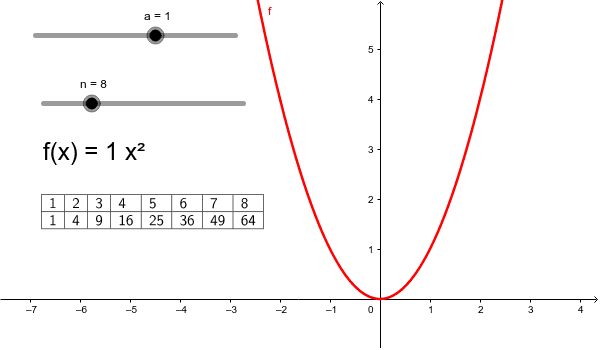
This example demonstrates a parabola with an accompanying table of values. Key math concepts include quadratic functions, power functions, and coordinate geometry. It is constructed using the GeoGebra command TableText and involves objects like a, f, n, text1, text2. Suitable for high school students learning function graphs, properties, and data visualization.
GeoGebra Commands & Parameters
TableText({Sequence[i, i, 1, n], Sequence[f(i), i, 1, n]}, "|_") → text1
AI Drawing Prompt Reference
Draw a parabola with an accompanying table of values showing the function's output for a sequence of x-values from 1 to n, separated by vertical bars, illustrating quadratic and power functions, coordinate geometry, suitable for high school students learning function graphs, properties, and data visualization.
The prompt above was compiled from the original drawing commands and is for reference only.