
Parabola Investigation by David Cox
Loading the math board and drawing, please wait…
In collections
Quadratic functions
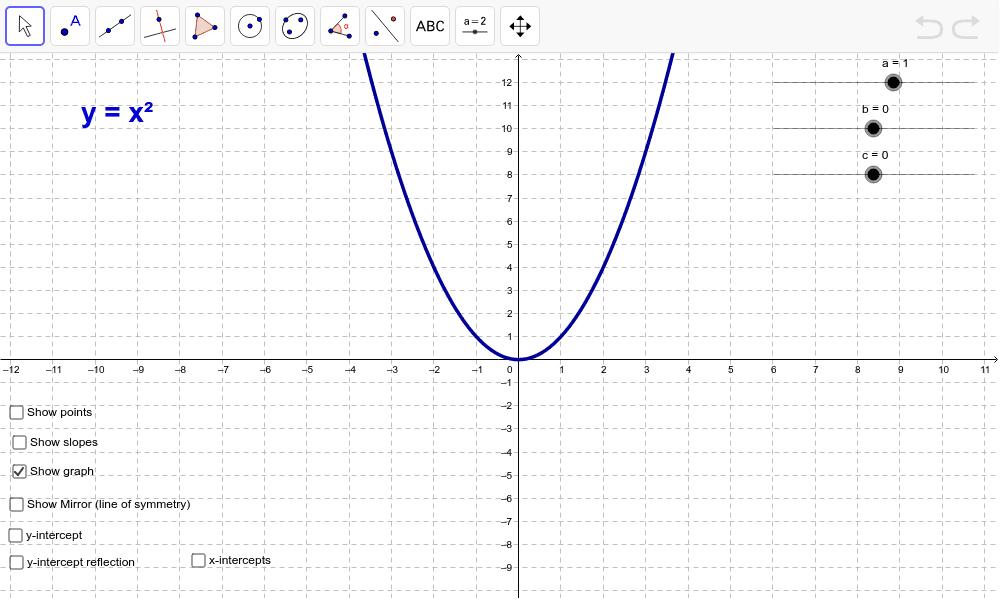
This example demonstrates the effects of parameters a, b, and c on the graph of a parabola. It involves core mathematical concepts such as quadratic functions and the geometric transformation of function graphs due to parameter changes. The construction utilizes GeoGebra commands/objects like OrthogonalLine, Intersect, Segment, Distance, and Point. It is suitable for high school students to learn and understand the rules of function graph transformations and for mathematical exploration activities.
GeoGebra Commands & Parameters
OrthogonalLine(A, yAxis) → dOrthogonalLine(B, yAxis) → eOrthogonalLine(C, yAxis) → gOrthogonalLine(D, yAxis) → hOrthogonalLine(G, xAxis) → iOrthogonalLine(F, xAxis) → jOrthogonalLine(E, xAxis) → kOrthogonalLine(B, xAxis) → lOrthogonalLine(C, xAxis) → mOrthogonalLine(D, xAxis) → nIntersect(g, i) → HIntersect(e, j) → IIntersect(d, k) → JIntersect(d, l) → KIntersect(e, m) → LIntersect(g, n) → MSegment(A, K) → pSegment(K, B) → qSegment(B, L) → rSegment(L, C) → sSegment(C, M) → tSegment(M, D) → a_1Segment(A, J) → b_1Segment(J, E) → c_1Segment(E, I) → d_1Segment(I, F) → e_1Segment(F, H) → f_1Segment(H, G) → g_1Distance(a_1, s) → oDistance(q, c_1) → uDistance(e_1, g_1) → vPoint(j_1) → PIntersect(f, xAxis) → Q, R