
Red Point Blue Line
Loading the math board and drawing, please wait…
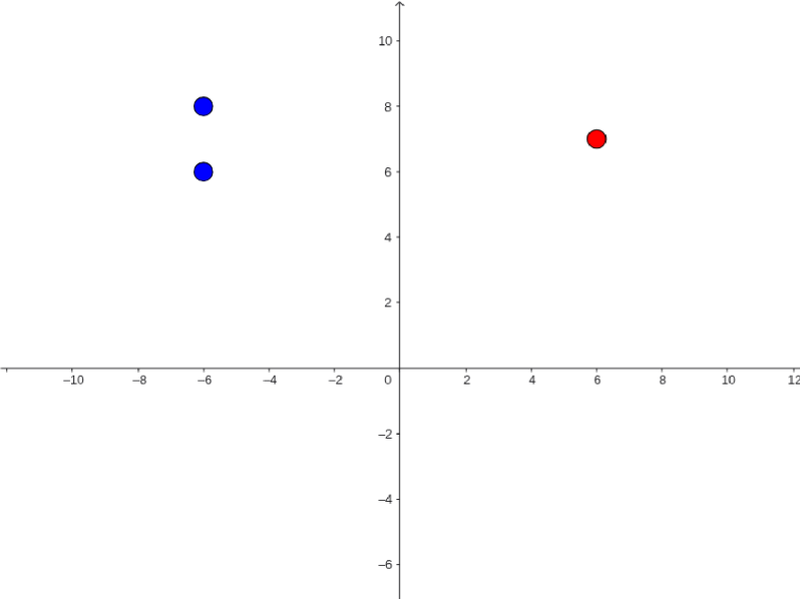
This example demonstrates random generated lines and points. It involves concepts of straight lines and probability distribution. By using the Random command to generate random points and lines, and leveraging GeoGebra's graphing capabilities, it provides a visual understanding of the properties of lines and the randomness of probability distributions. Suitable for high school mathematics education and learning, particularly in coordinate geometry and probability & statistics courses.
GeoGebra Commands & Parameters
Random(3, 8) → fRandom(1, 3) → e
AI Drawing Prompt Reference
Draw a randomly generated blue line and place a red point on it. Use the Random function to determine the slope and intercept of the line, as well as the coordinates of the point.
The prompt above was compiled from the original drawing commands and is for reference only.