
Estimating Decimals
Loading the math board and drawing, please wait…
In collections
Fractions, Decimals, and Percents
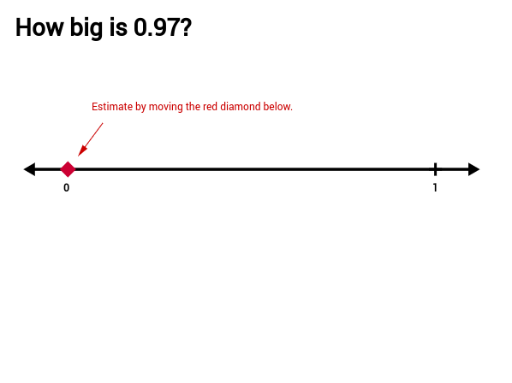
This example uses a number line to help students estimate the position of percents. The core math concepts involved are percentages. It utilizes commands like Segment, Point, Sequence, and Vector in GeoGebra. Suitable for high-grade elementary or low-grade middle school students.
GeoGebra Commands & Parameters
Segment(D, C) → aSegment(A, B) → bPoint(b) → ESequence(A + ((1, 0) * k), k, 1, 9) → list1Point(b) → GVector(H, I) → uVector(J, F) → vVector(L, M) → w
AI Drawing Prompt Reference
Draw a horizontal line segment as a number line with equally spaced points to represent percentage positions, use vectors to show directions and displacements, and incorporate a slider to dynamically adjust point positions, illustrating the relationship between percentages and the number line for educational purposes.
The prompt above was compiled from the original drawing commands and is for reference only.