
Open Middle Slope Exercise (V2): Geometry-Guided Curve Sketching
Loading the math board and drawing, please wait…
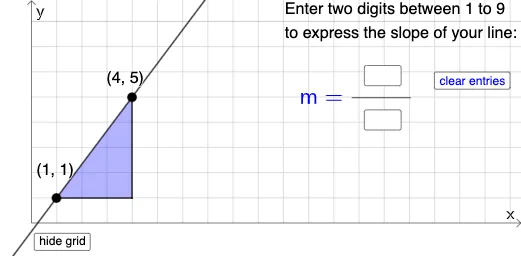
This GeoGebra example demonstrates an “open middle slope” investigation that helps learners infer how a curve’s key behavior changes by focusing on slope (tangent/line slope) at selected locations. It combines the geometric constraints of a constructed configuration with slope readings to guide accurate curve sketching and interpretation of trends. The main math concepts are slope and rate of change, coordinate-geometry reasoning from constructed points and lines, and graphing/curve sketching supported by interactive feedback; it is also aligned with early visualization of calculus-related ideas when used with slope-to-area/accumulation interpretations. Construction uses PointIn, Line, Polygon, and Segment to build and constrain the figure; Slope to compute/display slope values; Textfield and Mode to label and control views; and If to update elements dynamically based on user input. Interactive objects (InputBox1/InputBox2, button1/button2) and many labeled points (e.g., d, c, b, a, e, A, B, C, t1 and others) support the step-by-step exploration, making it suitable for classroom discovery, guided practice, and pre-calculus graph comprehension for upper secondary students.
GeoGebra Commands & Parameters
PointIn(e) → APointIn(o) → BLine(A, B) → fPolygon(A, C, B) → t1, b_1, a_1, c_1Segment(B, C) → gSegment(C, A) → hSlope(f) → iTextfield(k) → InputBox2Textfield(j) → InputBox1Mode(l1) → l2If(Length[l2] ≟ 0, "You have no repeated digits!", "You have repeated digits.") → text5If(j / k ≟ i, "This value is correct!", "Sorry. This is not correct.") → text4
AI Drawing Prompt Reference
Draw a coordinate-plane setup starting with two chosen points and connect them to form a reference line. Add a third point to create a triangular polygonal region bounded by segments, and draw the three defining segments that enclose that shape. Compute and display the slope value of the reference line as the key quantity for an “open middle slope” investigation. Include two input fields for user-provided numbers and a mode toggle, along with dynamic feedback text that changes depending on conditions such as repeated digits or whether a user ratio matches the displayed slope reading. Arrange everything so the geometry (points/segments) and the slope measurement guide step-by-step understanding of how the curve’s behavior can be inferred from local slope.
The prompt above was compiled from the original drawing commands and is for reference only.