
One-to-One Function
Loading the math board and drawing, please wait…
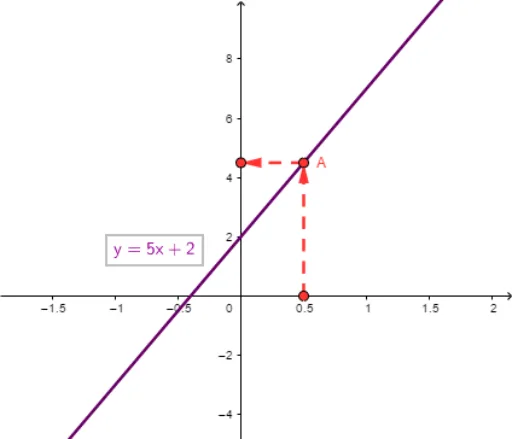
This example demonstrates the graphical properties of a one-to-one function. It involves core math concepts like domain, range, and unique correspondence. Constructed using GeoGebra commands such as Point and Vector. Suitable for high school mathematics teaching to understand the injectivity of functions and their graph characteristics.
GeoGebra Commands & Parameters
Point(f) → AVector(E, A) → wVector(A, F) → z
AI Drawing Prompt Reference
Draw the graph of a one-to-one function showing the correspondence between the domain and range. Start by picking a point A on the function, then draw vectors w from the origin to A and z from A to another point F on the graph.
The prompt above was compiled from the original drawing commands and is for reference only.