
One-Son Policy Simulation
Loading the math board and drawing, please wait…
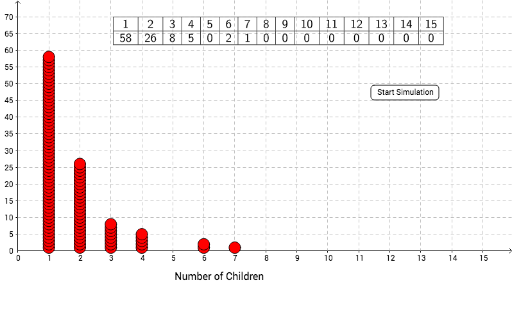
This example demonstrates the impact of the 'One-Son Policy' on a country's population. It involves core concepts of probability and statistics, simulating the policy effect by randomly generating the number of children in families. GeoGebra commands such as Random, DotPlot, and CountIf are used to analyze data through statistical charts. Suitable for high school and above students or teachers to understand the practical application of probability and statistics.
GeoGebra Commands & Parameters
Random(0, 1) → A1DotPlot(data) → list1CountIf(x ≟ 1, data) → aCountIf(x ≟ B1, data) → C1CountIf(x ≟ B2, data) → C2CountIf(x ≟ B3, data) → C3CountIf(x ≟ B4, data) → C4CountIf(x ≟ B5, data) → C5CountIf(x ≟ B6, data) → C6CountIf(x ≟ B7, data) → C7CountIf(x ≟ B8, data) → C8CountIf(x ≟ B9, data) → C9CountIf(x ≟ B10, data) → C10CountIf(x ≟ B11, data) → C11CountIf(x ≟ B12, data) → C12CountIf(x ≟ B13, data) → C13CountIf(x ≟ B14, data) → C14CountIf(x ≟ B15, data) → C15TableText({list2, list3}, "c|_") → text2
AI Drawing Prompt Reference
Create a population statistics chart showing the impact of the 'One-Child Policy'. First, randomly generate the number of children in families, then use a dot plot to display the data distribution. Next, count the number of families with each possible number of children (0 to 15) and present these counts in a table.
The prompt above was compiled from the original drawing commands and is for reference only.