
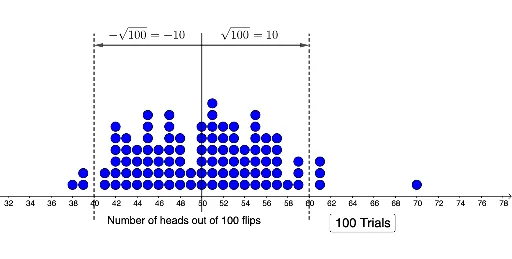
One Hundred Trials of 100 Coin Flips: Number of Heads
Loading the math board and drawing, please wait…
This GeoGebra example simulates 100 independent trials, each flipping 100 coins, and records the number of heads per trial, displaying the results as a dot plot to reveal the underlying distribution. The core mathematical concepts include the binomial distribution, stochastic processes, and the median value, with connections to continuity and power functions. Construction details: the RandomBinomial command generates random data, DotPlot visualizes the frequency of head counts, Segment and Vector create auxiliary lines and arrows, and a button (button1) allows interactive re-simulation. Key objects include data list, distribution curve f, median line l1, and text labels. This resource is ideal for high school or introductory college statistics courses, helping students grasp the shape of binomial distributions, central tendency, and random variability, while also supporting discussions on the law of large numbers and empirical probability.
GeoGebra Commands & Parameters
RandomBinomial(100, 0.5) → bDotPlot(data) → l1Segment((50, -2), (50, 14)) → fVector((50, 13), (60, 13)) → uVector((50, 13), (40, 13)) → vSegment((40, -2), (40, 14)) → gSegment((60, -2), (60, 14)) → h