
Normal vs RVsigma - Proof of Standard Deviation
Loading the math board and drawing, please wait…
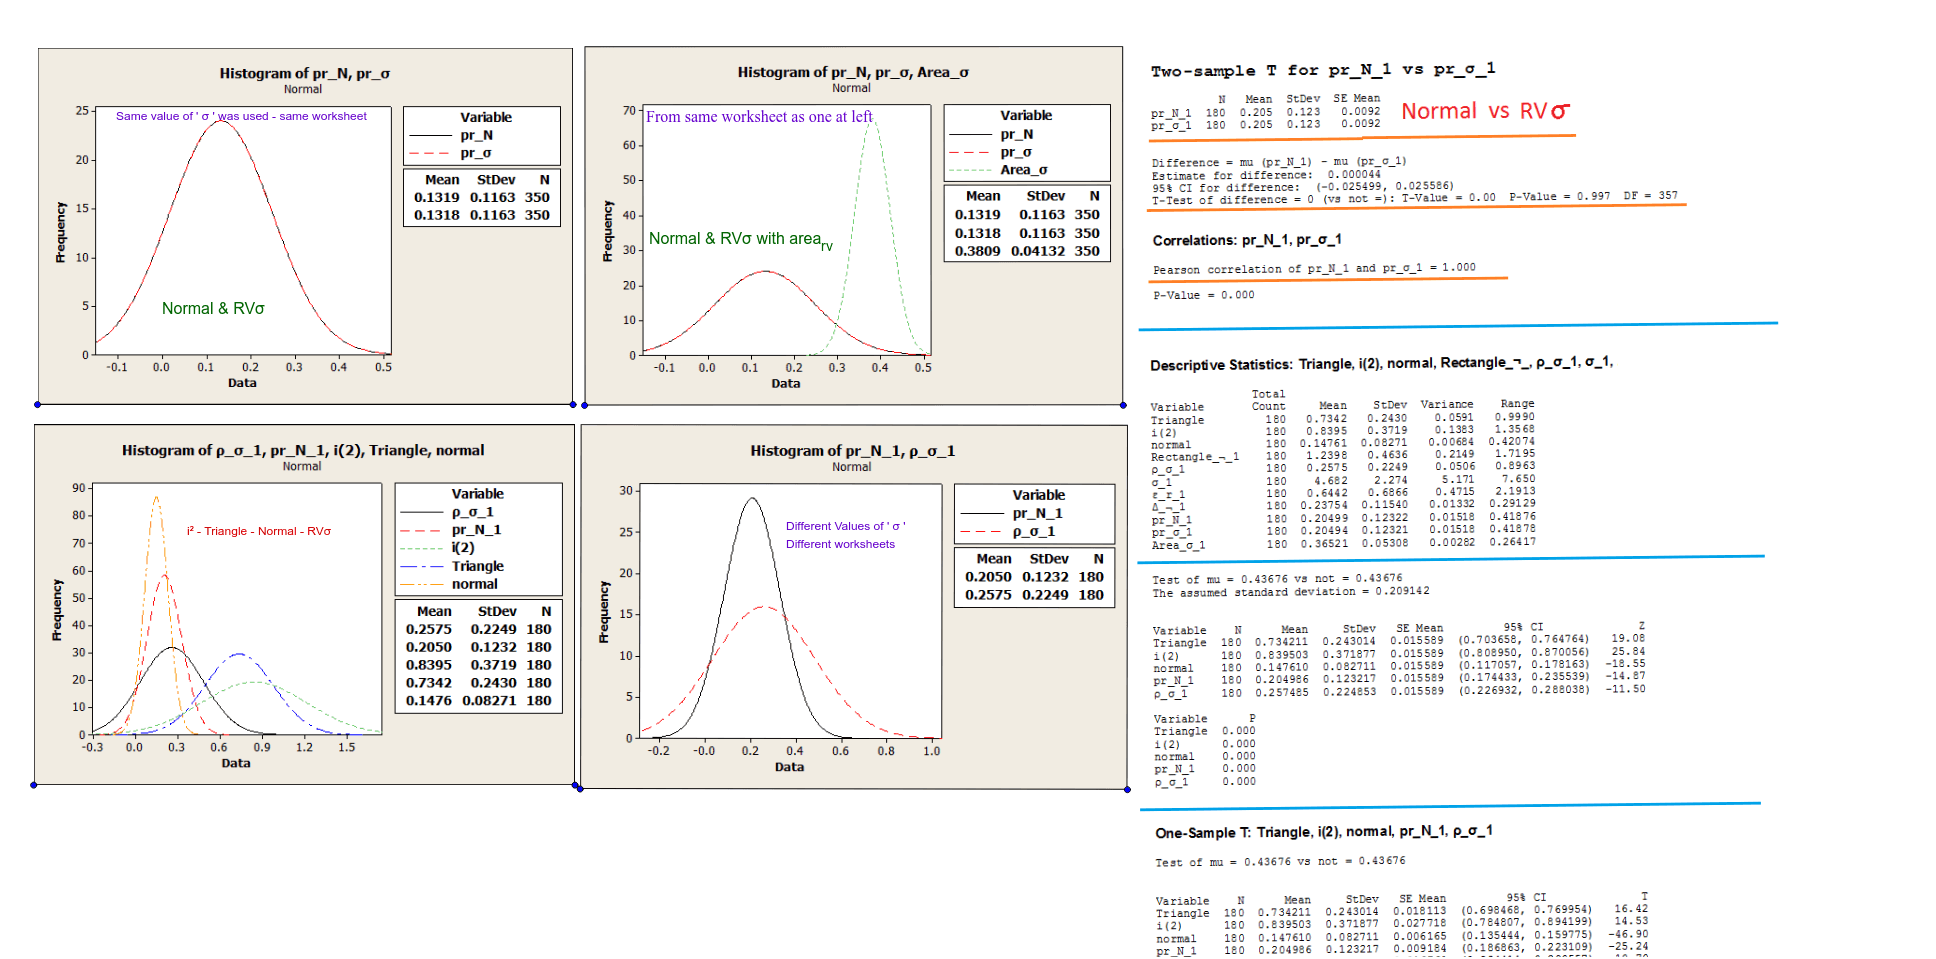
This example demonstrates how RV-sigma equals the standard deviation of the normal distribution curve, validated through data graphs and tests. Key math concepts include normal distribution, standard deviation, and data visualization. GeoGebra commands/objects used: A, B, pic1, C, D, pic2, E, F, pic3, G, H, pic4, text1, text2, text3, text4, text5, text6, I, J, pic5. Suitable for high school and above learners to understand properties of normal distribution in probability statistics.
GeoGebra Commands & Parameters
Point A(-6.242, -1.164)Point B(6.718, -1.164)Point C(6.997, -1.1836)Point D(20.033, -1.1796)Point E(-6.3348, -10.372)Point F(6.7652, -10.372)Point G(6.8902, -10.4658)Point H(20.1342, -10.4823)Point I(20.5104, -23.8)Point J(40.669, -23.5822)