
Normal Distribution vs. t-distribution
Loading the math board and drawing, please wait…
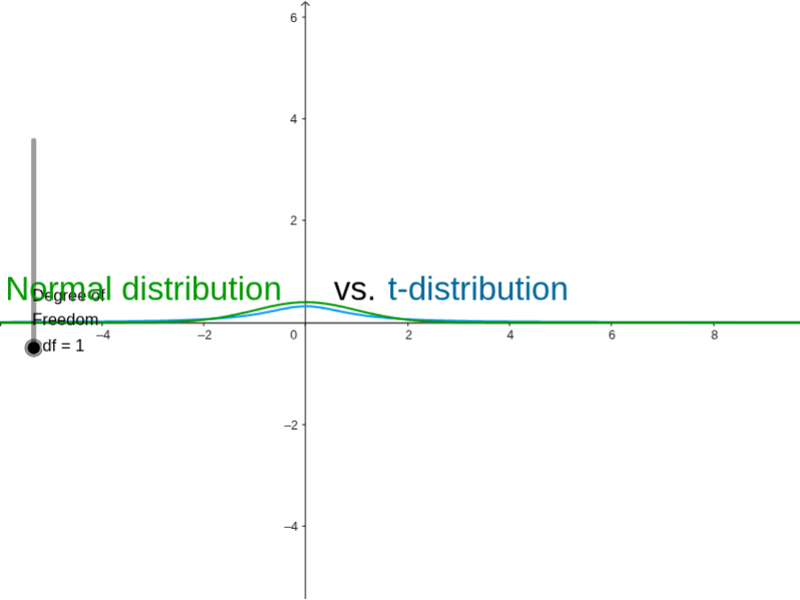
This example demonstrates the comparison between the normal distribution and the t-distribution. It involves two important distributions in probability and statistics. Using the TDistribution command, the example shows t-distributions with different degrees of freedom and compares them with the normal distribution. Suitable for high school or university probability and statistics courses to help students understand the characteristics of different distributions.
GeoGebra Commands & Parameters
TDistribution(df, x) → fNormal(0, 1, x) → g
AI Drawing Prompt Reference
Plot the standard normal distribution and t-distributions with different degrees of freedom for comparison. First, plot the standard normal distribution curve, then plot t-distribution curves with degrees of freedom 1, 5, and 30, and display them on the same coordinate system to visually compare their shape differences.
The prompt above was compiled from the original drawing commands and is for reference only.