
AP Stats Grade Simulator
Loading the math board and drawing, please wait…
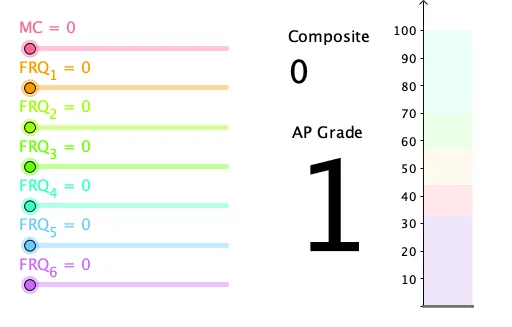
This example demonstrates how to simulate AP Statistics exam grade distributions and predictions using GeoGebra. It involves core concepts like probability & statistics, linear programming, and coordinate geometry. Construction highlights include commands like If, Point, Intersect, OrthogonalLine, Polygon. Suitable for high school statistics and mathematical modeling education.
GeoGebra Commands & Parameters
If(RAW > 70, 5, RAW > 57, 4, RAW > 44, 3, RAW > 33, 2, RAW ≥ 0, 1) → APGradePoint({0, RAW}) → AIntersect(xAxis, yAxis) → BPoint(xAxis) → COrthogonalLine(A, yAxis) → fOrthogonalLine(C, f) → gIntersect(f, g) → DPoint({0, 33}) → EPoint({0, 44}) → FPoint({0, 57}) → GPoint({0, 70}) → HOrthogonalLine(E, yAxis) → hOrthogonalLine(F, yAxis) → iOrthogonalLine(G, yAxis) → jOrthogonalLine(H, yAxis) → kPoint({0, 100}) → IOrthogonalLine(I, yAxis) → lIntersect(g, h) → JIntersect(g, i) → KIntersect(g, j) → LIntersect(g, k) → MIntersect(g, l) → NPolygon(E, B, C, J) → q1, e, b, c, j_1Polygon(E, F, K, J) → q2, e_1, f_1, k_1, j_2Polygon(F, G, L, K) → q3, f_2, g_1, l_1, k_2Polygon(G, H, M, L) → q4, g_2, h_1, m, l_2Polygon(H, I, N, M) → q5, h_2, i_1, n, m_1Polygon(A, D, C, B) → q6, a, d, c_1, b_1
AI Drawing Prompt Reference
Draw a coordinate system with x-axis from 0 to 100 and y-axis with marks at 0, 33, 44, 57, 70. Connect these points to form a pentagon. Draw perpendicular lines from these y-marks to the x-axis, intersecting the pentagon's sides to create several points. Connect these points and the vertices to form five smaller polygons, depicting a piecewise function.
The prompt above was compiled from the original drawing commands and is for reference only.