
Median-Median Line vs. LSRL for Twelve Points
Loading the math board and drawing, please wait…
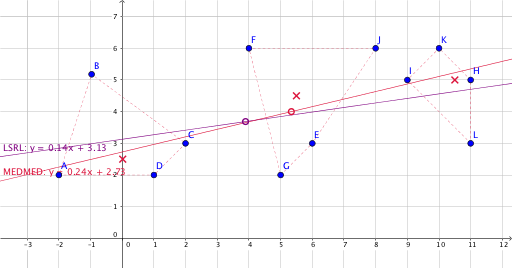
This example demonstrates the comparison between the Median-Median Line (MMM) and the Least Squares Regression Line (LSRL) using twelve data points. Key mathematical concepts involved include regression analysis, median calculation, convex hull, centroid computation, and line fitting. The construction utilizes GeoGebra commands and objects such as Sort, Take, Centroid, ConvexHull, Line, and FitLineY. It is suitable for high school mathematics and statistics courses to illustrate the characteristics and applications of different regression methods.
GeoGebra Commands & Parameters
FitLineY({A, B, C, D, E, F, G, H, I}) → LSRLSort(data) → list1Take(list1, 1, 4) → list2Take(list1, 5, 8) → list3Take(list1, 9, 12) → list4Centroid(Polygon[K_1, L_1, M]) → NSort({K_1, L_1, M}) → mmmConvexHull(list2) → graph1ConvexHull(list3) → graph2ConvexHull(list4) → graph3Line(Centroid[Polygon[{K_1, L_1, M}]], Line[Element[mmm, 1], Element[mmm, 3]]) → MEDMED
AI Drawing Prompt Reference
Draw a scatter plot with twelve data points. Sort the points by x-coordinate and divide them into three groups of four. For each group, draw its convex hull. Identify the median point in each group, and connect the medians of the first and third groups with a line. Then compute the centroid of the triangle formed by the three medians, and shift the line to pass through this centroid, creating the median-median line. Also draw the least-squares regression line for all twelve points. Clearly label both lines and the data points.
The prompt above was compiled from the original drawing commands and is for reference only.