
Graphing Systems of Inequalities
Loading the math board and drawing, please wait…
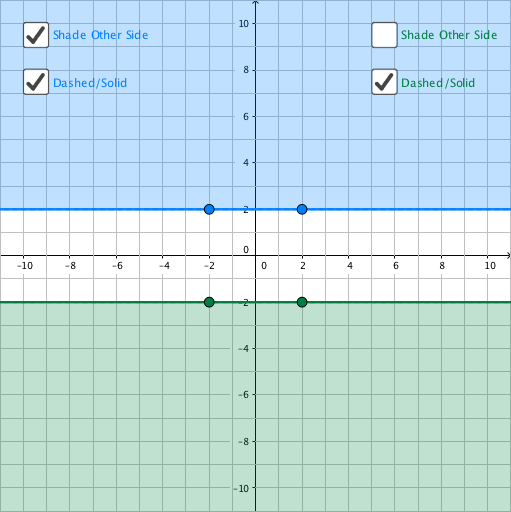
This example demonstrates how to graph the solution set of a system of inequalities in a coordinate plane. Key math concepts include inequalities, linear equations, function graphs, and region representation. Construction highlights involve GeoGebra commands/objects like Line, points P1/P2, line l1, parameters a/b/c, button button1, and functions f/g. Suitable for high school students learning to visualize and understand inequality systems.
GeoGebra Commands & Parameters
Line(P1, P2) → aLine(P1_1, P2_1) → a_1
AI Drawing Prompt Reference
Draw a coordinate plane graph of a system of inequalities, including two lines l1 and l1_1, defined by points P1 and P2, and points P1_1 and P2_1 respectively. First, draw line l1, then draw line l1_1. These two lines divide the coordinate plane into different regions, and we need to indicate the regions that satisfy the system of inequalities.
The prompt above was compiled from the original drawing commands and is for reference only.