
Normal Distribution: Visualizing the Roles of Mean μ and Standard Deviation σ
Loading the math board and drawing, please wait…
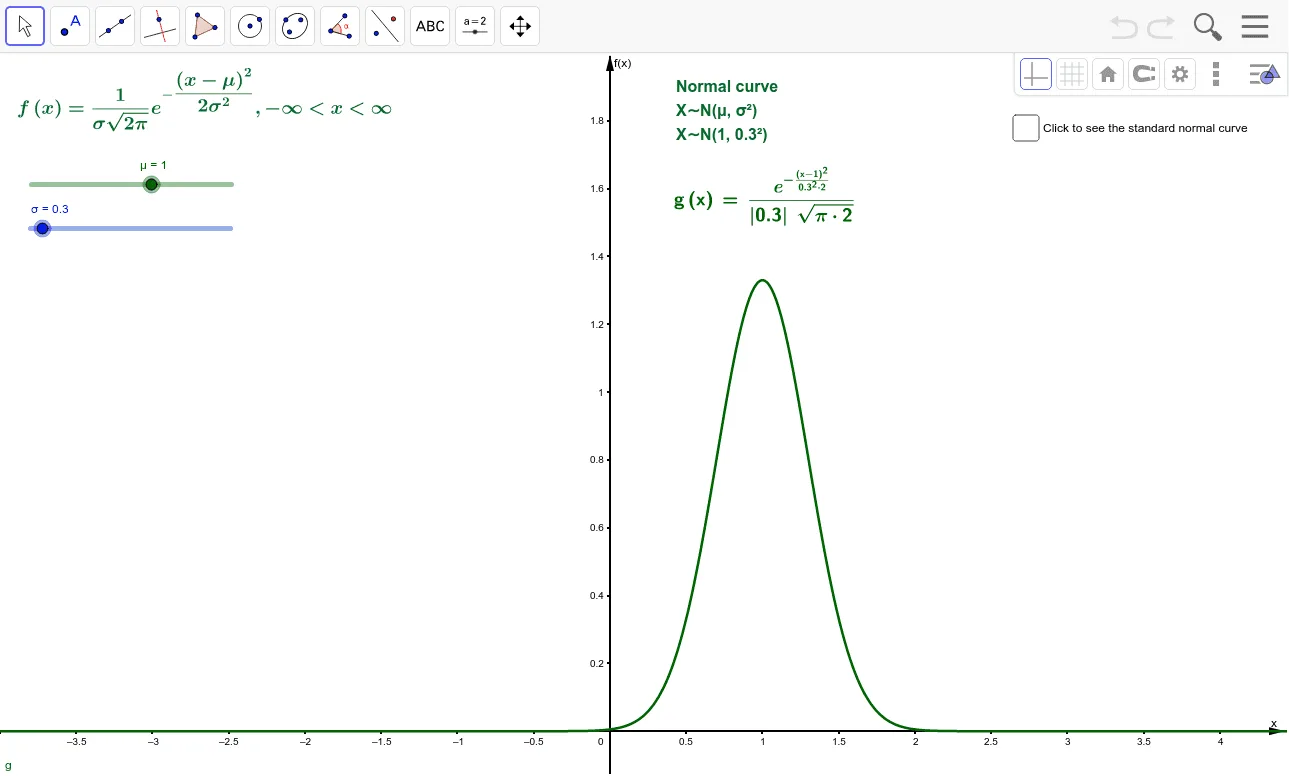
This GeoGebra example dynamically demonstrates how the normal distribution probability density function changes with different values of mean μ (determining the center) and standard deviation σ (determining the spread). The core mathematical concepts include the normal density function, statistical interpretation of mean and standard deviation, and parameter sensitivity of the bell curve. Key construction details: Using the Normal command to plot density curves f and g, employing LaTeX for precise mathematical formulas text1-text6, and incorporating slider 'a' for dynamic parameter adjustment. Ideal for high school and introductory college statistics courses, as well as a visual introduction to the Central Limit Theorem.
GeoGebra Commands & Parameters
Normal(0, 1, x) → fNormal(μ, σ, x) → gLaTeX(g, true, true) → text1LaTeX(f, true, true) → text2
AI Drawing Prompt Reference
Draw a graph of a normal distribution to show the effect of mean μ and standard deviation σ on the curve. Use two curves: one with fixed parameters and another that dynamically adjusts via a slider. Display the curves on a coordinate system and label key points like the mean and standard deviation. Ensure the graph is clear for understanding the concept of the normal distribution.
The prompt above was compiled from the original drawing commands and is for reference only.