
Binomial to Normal Distribution with Gamma Coeff
Loading the math board and drawing, please wait…
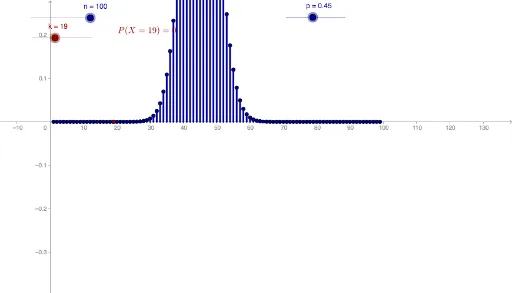
This example demonstrates how a binomial distribution can be transformed into a normal distribution using a gamma coefficient. Key math concepts include binomial distribution, normal distribution, gamma coefficient, hypothesis testing, linear equations, and mode. It uses GeoGebra commands like Sequence, Element, and Segment to construct the visualization, making it suitable for high school and above students learning probability & statistics and distribution transformations.
GeoGebra Commands & Parameters
Sequence((((gamma(n) / ((gamma(k) * gamma(n - k))) * p^(k)) * (1 - p)^(n - k)) * p), k, 0, n) → sSequence((i, Element[s, i + 1]), i, 0, n) → pointsSequence(Segment[Element[points, i + 1], (i, 0)], i, 0, n) → segmentsElement(points, k + 1) → kPointSegment((k, 0), Element[points, k + 1]) → kSeg
AI Drawing Prompt Reference
Draw a discrete binomial probability mass function with integer k from 0 to n on the horizontal axis and probability on the vertical axis, compute the binomial coefficients using the gamma function, plot a vertical bar for each k from the axis to the probability point forming a bar chart, and highlight the bar at a specific k with a distinct color or thicker line.
The prompt above was compiled from the original drawing commands and is for reference only.