
Normal Distribution Puzzles: Random Sampling and Probability Exploration
Loading the math board and drawing, please wait…
In collections
Normal Distribution Practice Problems
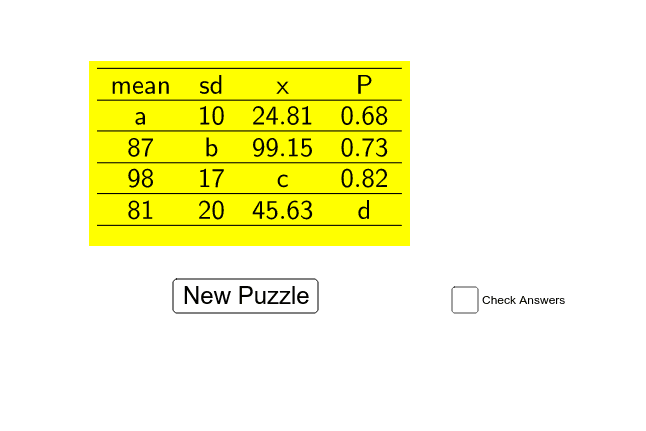
This GeoGebra example demonstrates a normal distribution puzzle by generating random samples and comparing their behavior with the normal probability density curve. It highlights probability and statistics concepts such as random processes, normal distribution, mean, standard deviation, sampling variability, and probability density functions. The construction uses Random and Normal commands to create random data or normal random variables, stores results in list objects such as list1, list2, and list3, and displays tables and formulas with TableText and LaTeX. A button and text objects support interactive exploration. It is suitable for high school probability and statistics, introductory college statistics, or mathematical modeling activities focused on random simulation and normal approximation.
GeoGebra Commands & Parameters
Random(10, 20) → s3Random(5, 25) → s4Random(50, 100) → m4Random(50, 100) → m3Random(50, 100) → m2Random(5, 25) → bRandom(20, 80) → aRandom(5, 25) → s1Normal(a, s1, x1) → p1Normal(m2, b, x2) → p2Normal(m3, s3, c) → p3TableText({list5, list1, list2, list3, list4, "c"}, "c_") → text1Normal(m4, s4, x4) → dLaTeX(a, true, true) → text2LaTeX(b, true, true) → text3LaTeX(c, true, true) → text4LaTeX(d, true, true) → text5
AI Drawing Prompt Reference
Draw a normal distribution curve to compare with random samples. First, generate five random numbers as means and standard deviations, then use these values to draw three normal distribution curves. Next, create a table to display these random samples and means, and finally show these values in LaTeX format.
The prompt above was compiled from the original drawing commands and is for reference only.