
Normal Distribution Parameter Changes and Interval Probability
Loading the math board and drawing, please wait…
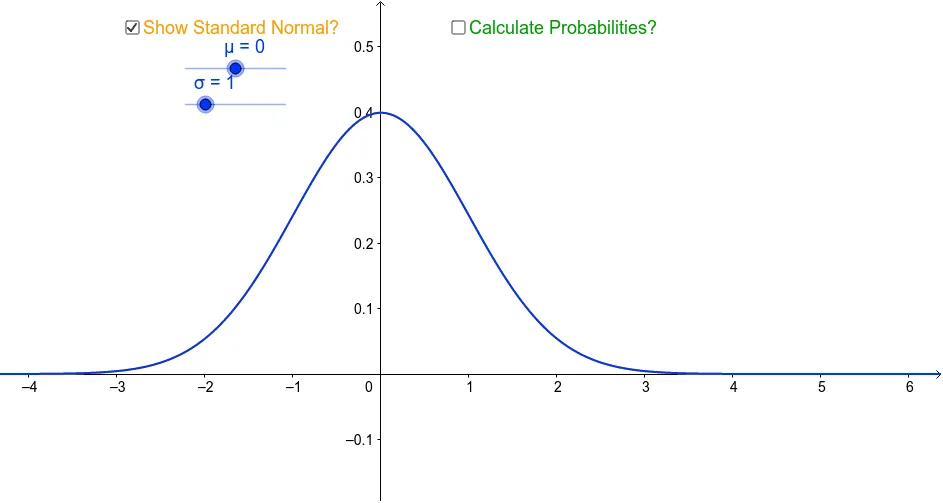
This example demonstrates how changing the mean (μ) and standard deviation (σ) reshapes the normal distribution curve, and how to compute the probability (area under the curve) between two chosen x-values. It focuses on key ideas from probability and calculus: the normal density function, the role of μ shifting the center and σ controlling spread, and the use of definite integrals to obtain interval probabilities. In GeoGebra, the construction relies on creating an integration interval using Segment (to mark lower/upper bounds such as lower, upper and corresponding points like B1/B2), then applying IntegralBetween to the relevant normal density expression with respect to the variable t over [lower, upper]. The objects/parameters (μ, σ, exponent/e-based terms, standardization variable z, and function f) indicate that the model builds the normal pdf formula and evaluates the required area to produce the probability results. Suitable for high school through early undergraduate students studying probability & statistics and introductory calculus, and useful for interactive learning via sliders to connect distribution parameters with computed probabilities.
GeoGebra Commands & Parameters
Segment(A1, A2) → lowerSegment(B1, B2) → upperIntegralBetween(f, 0, μ * t + t * a * σ + (1 - t) * a, μ * t + t * b * σ + (1 - t) * b) → integral
AI Drawing Prompt Reference
Draw a normal distribution curve and adjust its position and width by sliding μ and σ. Select two points on the x-axis to define an integration interval, calculate and show the area under the curve within this interval, which represents the probability of that interval.
The prompt above was compiled from the original drawing commands and is for reference only.